
Economics Is a Science, Part 3
Common characteristics with other sciences

This will be the part of the series that most directly addresses the question of how “scientific” economics is. To do this, we’ll look at important features of science in general, and see how those features appear in economics (or don’t). Some of the features it has make it look even better than physics, while others make it clearly worse. I think you’ll agree that economics is very respectable as a scientific field when all of the evidence is taken together.
Some might consider this something of a word game, with the question of whether economics counts as a science depending largely on how we define science. This is true, but it doesn’t defeat the purpose of this text. It’s still worthwhile to explore whether economics fits different views of what can count as a science. To give the most obvious example, empiricism (the idea that all knowledge is derived from evidence through sense experience) is at the heart of almost any conception of science. The previous post showed that economists have a wealth of empirical tools. These have come to make up the bulk of work in economics:
We’ll begin with one of the most famous solutions to the “demarcation problem” of establishing what does and doesn’t count as science.
Falsifiability, rent control, and summarization
You would be hard-pressed to find a policy economists dislike more than rent control. Here’s Assar Lindbeck, writing in The political economy of the New Left: An outsider’s perspective:
In many cases rent control appears to be the most efficient technique presently known to destroy a city—except for bombing.
This is also an issue where economists sharply disagree with the public. Americans overwhelmingly support capping the amount a landlord can raise rent, with about 82% expressing support for the idea in a survey. In a survey by the Kent Clark Center, 74% of the surveyed economists disagreed that such a move would make middle-income Americans “substantially better off”, with 16% remaining uncertain and 2% agreeing.1
The views of economists are rarely diverse once you look closely. The lone economist who agreed in the rent control survey was Hilary Hoynes. One of her college presentations, available online, says that rent control causes a shortage of housing. It seems likely that she, like some economists who responded with an accompanying explanation of their position, wondered if specifically middle-income Americans would benefit from the distributional impact.2
This section is about falsifiability, not rent control—I’ve merely chosen this policy to use as an example case. Karl Popper was a famous “philosopher of science”, meaning a philosopher who studies how science is used to understand the world. He used the idea of falsifiability as a means of solving the “demarcation problem”, mentioned a moment ago. It might be helpful to stop and try to think of examples of pseudoscience and how they’re immune to falsification.
I’ll give you my own examples. You could, in principle, show that gravity is not a universal law by finding a large astral body that does not appear to have any. But suppose you’re given a crystal with “healing properties.” If you like science, you might come up with an experiment to see if it works, randomly keeping it with you some days and not others, and recording the results. If you’re especially good at science, you’ll find a placebo crystal to use on some days, and let a friend give you one or the other without telling you which is which. You’d probably find the real crystal does nothing. If you confronted the crystal salesman, they might tell you that it’s meant to improve your “spiritual energy”, rather than improve your physical health. That’s what makes its healing properties pseudoscientific. If you want to do science, you need your ideas to “take risks”, exposing themselves to falsification. If your outcomes are not observable, your ideas are not scientific.3
Popper took this idea a bit further by arguing that scientific theories can almost never be confirmed by evidence, only disproven. “All ravens are black” is a classic example where observing a white raven would definitely prove you wrong. But some philosophers still disagree about whether observing a black raven should make you more confident that all ravens are black, since you could always see a white raven someday.
Let’s return to the example of rent control. Supposing you think rent control increases access to housing, is there some way for you to falsify what economists say about rent control? Absolutely: we saw in the previous post that economists have the whole toolbox of econometric methods to test the effects of rent control. A study of rent control in New Jersey found that rent control policies there had a minimal impact on “rents, number of rooms, quality of units, and new rental construction”. This was cited in an article arguing that economists are wrong to hate rent control. So it seems that economics is falsifiable, and we’ve falsified the idea that rent control hurts accessibility.
But the economists aren’t wrong. The first issue is that the position economists hold is not really that rent control is bad per se, but that binding rent control is bad, i.e., rent control policies implemented where landlords would otherwise have chosen to charge higher rents. This would occur if, for example, rent control required 50% lower rents and nothing about supply or demand changed to accommodate such lower rents. (If the government required lower rents at the same time that landlords were going to cut rents anyway, that wouldn’t show that rent control works.) The lack of binding rent control policies in New Jersey is what the authors identified as an explanation for the unexpected behavior. The authors had specifically been looking at rent controls that limited the size of rent increases, and noted that these controls appeared moderate and “toothless”. So it seems that the article I mentioned, which argues in favor of rent control, was dishonest about the work it was citing.
But this feels similar to the effect of the crystal on your health, because you could just say “it must not have been binding” and move the goal posts every time someone finds that rent control didn’t hurt housing supply. This leads into a more general point to be made about any statement made by economists: “it depends” should usually be attached. The effects of a policy change will depend greatly on its magnitude. Economists would not be too concerned about a federal law capping the growth of rents at 200% per year, since landlords would very rarely raise rents that quickly. They are far more worried about other programs that appear to run the risk of recreating the failures of the most restrictive policies they have observed.
If you would like to know where to find those observations, here’s a summary of evidence on rent control from Richard Arnott, writing in 1997:
Nevertheless, the cumulative evidence—both quantitative and qualitative—strongly supports the predictions of the textbook model in virtually all respects. The decay and shrinkage of the rental housing markets in Britain and Israel caused by long-term rent control are persuasively documented in Coleman (1988) and Werczberger (1988), respectively; Friedrich v. Hayek (Fraser Institute, 1975) provides evidence of the harmful effects of hard rent controls in interwar Vienna, including their adverse effects on labour mobility; and Bertrand de Jouvenel (Fraser Institute, 1975) and Milton Friedman and George Stigler (Fraser Institute, 1975) argue strongly that the retention of controls immediately after World War II adversely affected the Paris and U.S. housing markets, respectively.
New York and San Francisco provide additional examples of cases where rent control failed, if you need more. Note that rent control does reduce rents for the people living in a city, but economists are usually benevolent enough to argue that people not living in a city shouldn’t be excluded from the large benefits of migrating to it. You can make housing more affordable for current residents using rent control, but if you did so everywhere, cities would struggle to grow by building more units. That would constrain upward mobility for some of the least privileged people in society.
In general, the statements economists make have fairly well-established exceptions that economists expect to observe from time to time. So while they might at times appear immune to falsification, that’s only because statements about economics are often simplified. “Rent control causes a shortage of housing” is not really what economists believe. Economists believe that binding rent control creates a shortage of housing in a competitive market, assuming no simultaneous changes in supply or demand to accommodate the forced decrease in rents. The annoying part of this specificity is that it means you have to understand economics before you challenge it. The nice part is that, eventually, there are clear ways you might falsify the ideas of economists.
You might identify a case where most landlords suddenly started charging at least 20% less than they were beforehand because of a broad rent control policy, and where the number of new units built increased. An economist might still be able to challenge your evidence by pointing to the elimination of regulations that previously made it expensive to build and maintain housing. You would have to make sure that both supply and demand remained constant to pose an effective challenge, but once you had done this, similar results were replicated elsewhere, and some reasonable theory had been created to explain the results, you would change their minds (and probably win the Nobel Memorial Prize in Economic Sciences).
You should take this level of complexity as a good thing that allows economists to explain more, not a bad thing that makes it harder to challenge their ideas. If I, or any real economist, were shown a housing market where supply is only provided by a state-protected private monopolist, we would probably predict that a rent control policy forcing rents down by 10% would not create a shortage. (The reasoning behind this will only be clear if you study the standard model of a monopolist, and would draw our focus in the wrong direction.) These additional predictive capabilities are rarely needed because most markets we observe seem fairly competitive.
It may be important that I provide a response to a common description of the problem of high rents: that landlords charge high rents because they are greedy, and refusing to impose rent control simply benefits them at the expense of renters. Rent control is a form of class warfare to many of its advocates. This is true, but it misses the point. As I described, economists are more concerned about the consequences of rent control for people who don’t live in an area, not the people who already do. Rent controls are very effective at lowering prices for people who already live somewhere, and very effective at keeping out people who might benefit from huge wage increases just by moving to a city.4 Economists don’t want to tell a simple story of class warfare. They advocate fiercely against rent controls because of the indirect “second-order” consequences of it for non-residents, which they have studied extensively.
Another issue you might be noticing is that it’s not clear how the evidence should be summarized, because there are so many different cases where rent control has been implemented in just as many different ways. If we want to be able to falsify ideas in economics, we need to be able to summarize attempts at falsification. And assuming there are negative effects, we’d like to be able to estimate and quantify how strong they are, and these estimates will inevitably vary.
The truth is that there is no single way to do this, but there are ways that you should find very convincing. But you shouldn’t take that to mean that anything goes, or that economics is pseudoscientific.
Problems with summarization are held in common with other sciences like medicine. You can find, for example, a study showing that elderly patients who received the mRNA COVID-19 vaccine were 22.5% more likely to develop Alzheimer’s. Vaccine skeptics were happy to post this study on Reddit, which is how I found it. But even if these results are accurate, you can also find a review of evidence on the vaccine’s effectiveness that says it reduces the rate at which people are hospitalized for the disease by 97.2%.
Now, I am but a lowly economics graduate and not a health professional. But the only real problem with believing the Alzheimer’s study, by all that I can tell, is the interpretation. The Alzheimer’s study looked at Koreans over 65, and Alzheimer’s occurs in just 10.25% of them, meaning they found the vaccine raises the rate to something like 12.56%. The difference is about 2 percentage points, meaning the study found a one in fifty chance that you get Alzheimer’s from the vaccine, assuming the correlation represents a causal effect of the vaccine. This is interesting, but hardly a good reason not to get the jab. The issue here is one example of the base rate fallacy, perhaps better called base rate neglect, wherein the general rate at which something occurs (in this case, the general rate of Alzheimer’s among those over 65 in Korea) is ignored to come to an incorrect conclusion (“the COVID-19 vaccine creates a significant risk of memory problems”).
Through the lens of falsification, there are some problems in economics. When Karl Popper wrote about falsification, he judged that a good scientist would actively try to expose their explanations to tests that might falsify them. I’m afraid I can’t say that economists are always like this, except as a collective, and that makes progress very slow. When David Card and Alan Krueger challenged the consensus on the effect of a minimum wage hike on employment with their study of a minimum wage hike in New Jersey, they received a lot of scorn from other economists. Some treated the idea that a minimum wage might raise employment, as they found in their study, as completely insane. Here is a fun quote from Nobel laureate James Buchanan, writing in the Wall Street Journal after Card and Krueger’s study was published:
The inverse relationship between quantity demanded and price [i.e. the idea that raising prices reduces the quantity people want to buy, all else equal] is the core proposition in economic science, which embodies the presupposition that human choice behavior is sufficiently rational to allow predictions to be made. Just as no physicist would claim that ‘water runs uphill,’ no self-respecting economist would claim that increases in the minimum wage increase employment. Such a claim, if seriously advanced, becomes equivalent to a denial that there is even minimal scientific content in economics, and that, in consequence, economists can do nothing but write as advocates for ideological interests. Fortunately, only a handful of economists are willing to throw over the teaching of two centuries; we have not yet become a bevy of camp-following whores.
It seems Buchanan wasn’t interested in evidence showing he was wrong, even only a little wrong. This doesn’t look like the kind of attitude Popper would describe as scientific. He does make a good point in saying that economists should not be “advocates for ideological interests”, but this only distracts from the question of whether the work Card and Krueger did was good.
Today, economists generally believe that the effect of a minimum wage hike on employment is indeed negative, but small, unlike past generations who believed the effect was fairly sizeable.5 They generally prefer other policies, like wage subsidies, as a way to improve the livelihoods of workers. I don’t think that this problem is unique to the field of economics, which is why it’s still worthwhile to engage with it if you care about science in general. But it’s certainly more common. I’ll give closer attention to the ability of the field to change in response to new evidence later. First, let’s take a closer look at summarization.
There are some problems with relying on surveys of economists to understand the world, as described by Scott Alexander. For one, the phrasing of survey questions could cause different results. Worse, the panel of economists you survey could matter a lot. 500 economists signed a letter warning against raising the federal minimum wage in 2009. Another 600 economists signed a letter five years later saying it would be a good idea.6 Here’s a plot of minimum wage employment elasticities found in various studies. (An elasticity refers to the percentage change in the quantity of something divided by the percentage change in the price. Here, the quantity is employment. You can just think of it as the effect of the minimum wage on employment, meaning values further to the left in the plot indicate that the minimum wage hurts employment.)7

“1/Se” means one divided by the standard error of the effect, explained in the previous post. If you didn’t read it or otherwise had a hard time with it, just think of the vertical axis as describing how confident you should be that the observed effect is real. This plot tells you that the typical effect is negative, but near zero.8 It was designed to reveal substantial publication bias in economics: while we expect to be measuring a real elasticity near zero and for random errors to occur, the errors are clearly not random and create a bulk of studies on the negative side. That suggests that studies are more likely to be published if they show a negative effect, or perhaps are often designed to show one where none exists. After adjusting for this bias, the effect appears to be slightly positive.
The evidence here is bewildering, and the ambiguity might be upsetting to you, but it doesn’t preclude economics from having a consensus. There are statements that we know are almost certainly false, based on available evidence:
The minimum wage generally reduces employment by “a lot”, i.e., the employment elasticity is typically less than -1.
The minimum wage generally raises employment by a lot.
The minimum wage always reduces employment.
We would prefer to have stronger beliefs about the minimum wage, but this is still a very useful consensus. It tells us that the minimum wage is not inarguably good or bad and can be a useful tool for raising wages, even if it can be expected to often reduce employment.
In general, if you wish to know what the consensus is among economists, start with the Kent Clark Center’s surveys. If you would like to be even more sure about it, look for other surveys and literature reviews. Do not rely wholly on credentials except as a last resort (e.g., “this economics PhD holder joined us for an interview and says x is a good policy”), instead, make sure that the speaker is themselves relying on some review of available evidence. It’s also good to check if they’re deviating substantially from the evidence (even some Nobel winners catch “Nobel disease” and adopt nutty ideas). If you want to understand how that evidence identifies causal effects, return to the previous post.
The ability to falsify an idea, as a way to decide what is and is not science, has its issues. One issue is that some explanations we might want to falsify only tell you that something is very unlikely to happen, rather than telling you that it won’t happen at all. When playing cards with my family, I often shuffle the cards and claim that I thoroughly shuffled them. When they dislike the cards that they’re dealt and tell me that I didn’t shuffle properly, I tell them that any combination is possible with a properly shuffled deck. So it seems that my claim that I shuffled properly is unfalsifiable and pseudoscientific. This is obviously wrong, so we should create an exception.
Popper responded to this issue by saying that some ideas are falsifiable “in practice”, even if not literally falsifiable. Drawing three kings together is unlikely with a properly shuffled deck, but not impossible. Before handing out the cards, I should simply say that if out of the four cards everyone is dealt, everyone gets three matching cards, I will have failed to shuffle properly. This bar is very low, but it demonstrates the idea well enough. It would rarely cause problems for someone who shuffled properly.
Similarly, economists often consider certain outcomes to be very unlikely but not impossible. Right now, economists would say that it is very unlikely that the US experiences an economic boom with more than 3% real GDP growth each year for the next four years. Booms are rare in general, and the president has introduced a supply shock by raising tariffs. They would not necessarily be wrong if a boom happened anyway.
We should take a moment to explain exactly how the ideas of economists can be falsified when they make generalizations that they don’t guarantee to be true. Without making this clear, economics will look not just pseudoscientific, but meaningless. We won’t know how to interpret and understand the things economists and other social scientists are inclined to say with phrases like “it seems”.
In the previous part, I wrote the following:
The methods used by actual statisticians to forecast elections are more advanced than what I have presented here, but are fundamentally the same. They rely on polling data and other variables to forecast elections with random simulations. As you’ll see in the next part, which elaborates on exactly how these percentages work, they tend to be very good at their jobs.
Now we’re going to see what I was referring to when I said “how these percentages work”.
Confidence levels
In 2016, FiveThirtyEight, which primarily depended on the work of statistician Nate Silver, claimed that Hillary Clinton had a 70% chance of being elected President of the United States. Many today are happy to declare that Silver was wrong about this, and unfortunately for them, I will now be providing a very good explanation for why they’re wrong. None of them understand what Silver meant.
Most people agree that they aren’t always right about everything. If I wanted to try predicting the weather, I could say “I’m 71% confident it won’t rain in London tomorrow”, since that’s roughly the share of days in London where it doesn’t rain during a year.9 This leads us to a very explicit definition of confidence levels using the definition of the limit of a sequence, which is important in mathematics. You might be a little overwhelmed for a moment here. If you don’t like math, skip this part. It’s only been included because I like being formal and enjoy writing about math.
When I say I’m 70% confident it won’t rain in London tomorrow, I mean something like this:
∀ ε > 0, ∃ N ∈ ℕ such that ∀ n > N, | cn - 70%| < ε
where cn is the value of a time-ordered sequence of averages made by averaging the time-ordered list of claims I’ve made with 70% confidence and evaluating them as true (1) or false (0), and my statement about London is included in the construction of this sequence.
That’s very precise and might seem very nice if you know what all those symbols mean, but you’re probably feeling bewildered. As you’ll see in a moment, essentially what I’m claiming here is that in the long run, statements I make with 70% confidence are right 70% of the time.
Let’s begin by thinking about sequences. A sequence is an ordered list of numbers that have been enumerated. For example, {0, 5, 10, 15} is a sequence. We can call the first member “s1”, the second “s2”, and so on. We can refer to an arbitrary member of the sequence with “sn”, like we did in the funny statement with the symbols. This allows us to talk about members of the sequence with characteristics like “n > 1”, meaning they are past the first member.
The first symbol in that statement, an upside-down A, means “for all”, so I’m saying “for all ε > 0”. ε is a small number someone can pick to try to show I’m wrong. You could call it an error—let’s say it’s 5%. Then there’s a backwards E, which means “there exists”, followed by our last two weird symbols, “∈ ℕ”, which means “inside the set of natural numbers.” The natural numbers are the numbers you use for counting things. It includes 1, 2, 3, and so on. We use them to give names to members of sequences like the one used here.
Let’s bring all of that together. The first part of the funny symbol statement is “No matter how small an error you pick, there’s some N in the natural numbers [a position in our sequence of averages saying how often I’ve been right] such that…”
Let’s continue to the rest of the statement, “∀ n > N, | cn - 70%| < ε”. This is saying “for all n greater than some N we said we know exists, the difference between something called cn and 70% is less than the chosen error.”
What’s the sequence I described? We need to construct a simpler sequence before we can get it, which describes whether I was right (denoted with a 1) or wrong (denoted with a 0). If the only claim I ever make with 70% confidence is that it won’t rain in London tomorrow, the sequence of values saying whether I was right or wrong might look like this: {0, 1, 1, 0, 1, 0, 1, 1, 1}. The first 0 is there because it actually did rain, and I was wrong. Then there’s a 1 because it didn’t rain, meaning I was right, and so on.
The sequence of values cn is the sequence of averages of all preceding 1s and 0s: {0, 0.5, 0.66, 0.5, 0.6, 0.5, 0.57, 0.625, 0.66}. Think of this as the sequence that tells you how often I’ve been right in the past. Notice that the first number in this sequence is 0 because the first number in the original sequence is 0, and the average of a single number is that number itself.
For the first 9 predictions, the average of the values is about 0.66. This is pretty close to 0.7, which is what I’m saying the average will be in the long run. If you chose a 5% error, like I described, then I can say, “Look, if you take the first N = 9 numbers in the sequence, the average is 0.66. Its difference with 0.7 is less than 0.05. In other words, | cn - 70%| < ε. The same is true for every prediction after it (because there are no more predictions), so I was right.” That looks like what the statement was saying: I can find a point in the sequence at which the difference between cn and 70% is less than the small number you chose, and every number after that point is just as close.
Let’s try to put it all together. I’m saying that for all little errors you can think of, if you track my predictions long enough (pick a sufficiently large N), then after that point, for every value in the sequence that tells you how often I’ve been right in the past (cn), the difference between cn and 70% will be less than the small number you picked. In other words, I can become as accurate, on average, as anyone would like, so long as you wait long enough.
This is not really what statistical forecasters mean, because they can’t satisfy requirements this strict. I might have some bad luck and, after becoming as accurate as you requested, become less accurate. A weaker and more realistic form of this same idea can be stated as follows. This is what you should apply to forecasts in general.
When something is predicted with x% confidence, the following should be true:
∃ N ∈ ℕ, N < 1000, such that ∀ n > N, | cn - x%| < 10
This statement tells you that at some point, with fewer than 1000 predictions, the difference between how often someone has been correct and how often they claimed they would be correct is less than ten percentage points, and this remains true forever. The choice of 1000 predictions and a difference of less than 10 percentage points is arbitrary but suitable for most purposes. I would expect statisticians to often be even more accurate, meaning we can write something like “| cn - x%| < 5” instead.
Even after all this explaining, you might still struggle to understand. The most essential lesson here, however, is that if somebody tells you they’re 70% confident something will happen, what they’re saying is very different from claiming something will happen. They’re telling you they could be wrong, and how often they expect to be wrong about things they assign the same confidence level to. Nate Silver and the other people working at FiveThirtyEight in 2016 were saying there was a 30% chance that Trump would win instead of Hillary Clinton. In that case, Trump did win, and they allowed for this possibility. Communicating this essential idea has proven very difficult.
This might seem unfair. Why let experts escape from being wrong by just saying they’ll be wrong a certain percentage of the time? You would certainly prefer someone who is always right, but nobody like that exists. This way of thinking creates more accountability, not less. It formalizes the common idea that nobody is always right, and allows us to verify that someone makes accurate predictions. Below, you can see how often the statisticians at FiveThirtyEight (mostly just Nate Silver, to my knowledge) were right about different things.

To understand these charts, focus on the politics chart, and pick a number on the horizontal axis on the bottom. That’s the confidence level they gave for the outcome of many different elections. Now look at the dot above that confidence level, and check its position on the vertical axis. It should be very similar, meaning those election outcomes they forecasted happened as often as they said they would. Election outcomes that they claimed had a 50% chance of happening happened about 50% of the time—just look at that dot in the center of the graph. This might look confusing at first, but it’s really a wonderful form of humility and transparency. Anyone is free to record FiveThirtyEight’s predictions and make a chart just like this, so I wouldn’t expect it to be a fabrication.
Scientists outside of political forecasting organizations don’t have a habit of talking like this, because it’s potentially life-saving to say “Vaccines save lives” rather than “I am 95% confident vaccines won’t give your child autism” or anything to that effect. Skeptical attitudes can, in some cases, give the public a permission slip to think they know better than the experts and hurt themselves. Knowing that their work is highly specialized and difficult to understand, scientists prefer to communicate with authority in the same way a parent communicates with their child. This is demeaning, but likely saves lives. You might have an easier time sympathizing with this view if you encounter someone who is confidently incorrect about something you know a lot about.
Academic papers often include an analogous measure called confidence intervals. When trying to identify something with a random sample, scientists often report an interval of values and a confidence level. If a paper says something like “The 95% confidence interval for the effect of one dosage of the drug on a user’s weight in pounds is [-10, -1]”, they mean that a random sample with a confidence interval of this size will contain the true effect of the drug 95% of the time. In other words, they are 95% confident they have captured the real effect of the drug within their confidence interval, which is vulnerable to random chance to some degree.10
Knowing all of this, it should be clear that there is some good sense in uncertain predictions about the future, and that you should expect these from serious thinkers in science, including economists. That economists have been wrong about some things in the past is not a very effective indictment of their behavior.
Troublingly, few keep a quantitative track record like the one above, so we are often forced to judge based on the few examples we have seen from a particular expert. Depending on the sources you rely on, those examples may have been selected specifically to make them look bad—a comprehensive track record is often what we really need, but can rarely get.
Think about how misled you would have been if someone had only told you about Silver’s prediction in 2016 and none of the others. For an example of an economist being treated this way, consider this post on X, showing Paul Krugman’s prediction that the internet will have a minimal impact on the economy. In a certain sense, he was wrong. The internet permeates the whole economy and daily life for billions of people. It would have been better for Krugman to show some humility and say his prediction was “almost certain” or “likely”.
The question of whether internet access and growth are causally related is a bit more controversial, and I would have to dedicate substantial time to it to produce a summary. Some estimates suggest it does, but these effects don’t appear substantial. I personally suspect Krugman was wrong, but not very wrong. His wording would have benefited from additional specificity about the degree and type of impact. Albert Einstein, likewise, made a terrible mistake by thinking the universe was static rather than expanding. Despite this, we use his ideas every time we rely on GPS for navigation. Being wrong sometimes is not a crime.

Krugman may have been wrong about the internet, but he was right about other things. He warned that the fiscal stimulus passed into law during the Obama administration, the ARRA, would be an insufficient response to the Great Recession. As he expected, the United States experienced sluggish growth after the crisis compared to the relatively stable rate of growth that preceded it. European countries that engaged in austerity fared even worse.
In general, I would avoid extrapolating too much from the mistakes of economists and other experts. It’s better to learn more about them first.
Before proceeding, I should mention that it’s often not clear how a percentage interpretation can be given to statements about the economy. Krugman’s warning about ARRA included language like “could”:
But he suggested that inadequate economic policies in the U.S. today could lead to something akin to the so-called “lost decade” of economic growth in Japan during the 1990s and early 2000s. In fact, noting that Japan’s economy is falling precipitously today, Krugman said Japan could now be headed for “lost decades.”
“Could” includes things with only a 1% chance of happening, but that’s clearly not what he meant. Similar ambiguities could arise in other cases. The important thing is that predictions tend to occur more often as confidence unambiguously rises.
Unfortunately, surveys of economists have shown that they tend to be overconfident in their predictions of things like unemployment and inflation. I hope others will learn from these mistakes. But economists are more focused on making good policy recommendations than forecasting the economy. It would be a terrible error to judge them based on this, like judging the expertise of public health experts based on their ability to predict hurricanes. I expect economists to show better judgment in their own realm, especially in extreme cases where the literature points overwhelmingly against a policy, like with rent control. But I’m not aware of any study looking at this question retrospectively, i.e., judging whether the policy recommendations of economists have generally had their expected effects. This would be a good area for future study.
Laws in Economics
It’s come to my attention that, at least among some internet users, sciences require universal laws. I don’t think this is right―we’ve just seen that strong generalizations are meaningful even if they’re only generalizations. Regardless, we should spend some time examining whether or to what degree there are laws in economics.
The most obvious candidate for a law in economics is the idea that people make rational choices: faced with multiple options, people pick the one where the marginal benefit most exceeds the marginal cost. You wouldn’t buy an apple if you don’t like apples, and you wouldn’t work at Arby’s if you think the wage doesn’t compensate you for the working conditions. People generally don’t consider sunk costs and do consider opportunity costs. If, for example, you saw that you would benefit from going to a public university, you would still rather go to Harvard, since attending the public school would mean forgoing the benefits of Harvard.
But I would only describe this as a generalization that holds most of the time, and any economist with a bit of sense would agree. There are definitely exceptions, and these are well-documented in Daniel Kahneman’s Thinking Fast and Slow. For example, a rational actor should be just as likely to choose a surgery with a 90% survival rate as a surgery with a 10% mortality rate—these two numbers mean the same thing. But framing it as a 90% survival rate makes people more likely to choose it.
The exceptions don’t worry me. In the first place, these exceptions are ultimately evidence for the point I’m making: people are generally rational. Sometimes, people use quick thinking and apply heuristics that lead to irrational choices. Kahneman describes this as a problem caused by “System 1”. But these decisions implicitly endorse heuristics that generally lead to rational choices. In other words, people clearly choose to behave on the basis of rules that are usually rational.
The framing effect example suggests that people aim for high survival rates more than low mortality rates, but most of the time, doing this will still lead to the same, rational choice. If a disease kills 1% of the time, framing the surgery that treats it as having a 90% survival rate will do little to encourage someone to get it. They’re going to notice the irrationality of getting the surgery regardless. There are certain cases where this framing effect might matter, but like setting the price at $5.99 instead of $6, the effect is small.
With all the exceptions we can find, behavior is still usually rational, and that’s what counts. During the Alaskan oil boom, oil companies raised wages, attracting more workers to Alaska. That shows rational behavior in both parties. Every natural experiment featured in the previous part likewise showed, in some way, rational behavior. Firms were shown to prefer workers with greater signs of conscientiousness in the example describing the GPA-income connection. I don’t think the models of rational behavior involving utility functions are literally true to reality, but they aren’t meant to be, and instead provide a simple description of how people weigh costs and benefits in practice.
John T. Roberts (a philosopher of science, not the Supreme Court justice) has an excellent exploration of the more general question of whether the social sciences have laws, and if I could reasonably ask you to, I would tell you to read it instead of reading this. But that would take a while, so I’ll try to summarize his points before commenting.
Roberts believes the social sciences, including economics, do not have laws. In the sense he means this, I actually agree with him. The definition of law he uses is reasonable, but also very strict: he wrote that physicists probably haven’t discovered any laws yet, but “maybe someday” will, and that we don’t really know if physics has any laws. But he does say that the successful theories in physics posit some laws. The successful theories in the social sciences don’t, but they do suggest generalities, like the ones I’ve described.
On the question of whether the laws of supply and demand are really laws, he agrees with me that they’re only regularities, and there are plenty of exceptions. He uses price controls as an example of an exception: if demand rises without a commensurate increase in supply, prices would normally rise, but they can’t do that with a binding price control.
I don’t think this is a good example. Price controls are obvious and allow us to modify our predictions easily. The real trouble comes from other examples he gives, like the possibility that “humanitarian feelings on the part of many vendors motivate them not to raise prices on goods.” Under some formulations of rational choice theory, this would cause it to fail, but I would always include altruistic benefits among those considered by businesses when making choices. In any case, I’m not aware of any case of this actually happening.
Arguing that the laws of supply and demand can only be hedged laws, Roberts appeals to ignorance: if there are exceptions, “Who knows how many others there may be?” I’m inclined to agree. There might be laws in physics that hold everywhere, but the world is just too complicated for us to strictly identify every possible exception to the laws of supply and demand. Even an unexpected meteor strike can interfere with the outcomes of a market. The problems he describes are problems for all sciences, not just the social sciences, but they seem to cause more trouble for economics than physics.
Roberts spends some time arguing that because (i) social laws must be hedged, and (ii) there are no hedged laws, there are thus no social laws (i.e., laws in the social sciences). In short, refusing to hedge a social law by including exceptions means opening the law up to rapid falsification from some exception, because social systems are so complex. That shows, or at least suggests, that (i) is true. And if you do have a hedged law and try to include every exception possible, you inevitably don’t include all of them, showing (ii) is true. So there are no social laws.
He finishes by arguing that social science “need not posit laws”. Here’s the conclusion, which provides a good summary:
Prediction and explanation require reliable sources of information about the world, in the form of strict or statistical regularities. Laws of nature are regularities that have certain features: they are global or universal, and robust, in the sense that they do not depend on contingent details of particular systems of objects, and they would not be upset by changes in the actual circumstances that are physically possible. In order to have explanatory and predictive value, though, a regularity (strict or statistical) need not have these special features. Hence, not only does social science have no laws; it needs no laws.11
The book this is taken from, Contemporary Debates in Philosophy of Science, includes a pro and a con section for every part of the book, each talking about a question. Roberts’ argument is followed by “There are Laws in the Social Sciences” by Harold Kincaid. That would definitely help my case, but Roberts’ view comes closer to mine.
You might take the presence of both of these sections as an endorsement of the idea that all truth is relative, but I think you should learn to see past that and piece together the points held in common by different experts. Roberts and Kincaid alike would agree that the social sciences have documented regularities we can rely on to hold in the future. “Economics is inconsistent and tells you nothing about the world” is just an uninformed statement, which is why neither Roberts nor Kincaid believes it.
We should finish by looking closer at why Roberts thinks laws are unnecessary for science. I’ve already described how he believes physicists have yet to uncover any laws of physics, but this sounds ridiculous. Isn’t Newton’s second law of motion (F = MA, essentially) a law of physics? No, he says, because we’ve found exceptions. He didn’t name these exceptions to Newton’s second law, but I hunted one down for you: objects change in mass as they approach the speed of light. We know this from general relativity. So, a simple law about mass implied by Newton’s second law, M = F/A, is not true if A is sufficiently large. Apparently, similar problems arise even with general relativity and quantum mechanics, since they’re incompatible with each other.
My hope is that Roberts’ summary of the field of physics from 2004 is still accurate. After all, if such a profound development as finding the first true law of physics occurred, I’d expect to have heard about it. But the essential components of the argument should still hold regardless.
To summarize, it seems that there could be laws in physics, but not in economics. This is fine because we don’t even have laws of physics yet, so our current knowledge of physics would be tossed out as “unscientific” if we required the presence of laws. So either the regularities described by economics are scientific, or we don’t have science at all. I feel bad re-hashing Roberts’ argument so much, but it’s very strong.
Responsiveness to new evidence
Physicists once hypothesized the existence of “luminiferous ether”, something that filled the space between planets and permeated the air around us, allowing light to travel through a vacuum despite being a wave. In principle, this idea could be falsified, and it was: the Michelson–Morley experiment showed that there is no ether. The Earth orbits the Sun, so if the ether existed and filled the space around both bodies, there should be an “ether wind” caused by the movement of the Earth around the Sun. It couldn’t be stationary relative to the Earth at all times. Michelson and Morley attempted to measure the ether wind by measuring the speed of light in perpendicular directions, but found results consistent with no movement at all, leading physicists to the conclusion that the ether doesn’t exist and light propagates through empty space. Another experiment, the double-slit experiment, showed that light is both a particle and a wave.
It’s tiring to hear that the sciences should all seek to imitate physics. Sometimes, it’s just not possible. But responsiveness to new evidence is one of the most important features of any science. Otherwise, like Buchanan had said before, economists might be a “bevy of camp-following whores.”
Looking from the outside in, you might suspect that economists have believed the same things for a long time. This is plain wrong. Let’s begin with the example of Say’s Law, named after Jean-Baptiste Say. The law essentially states that supply creates its own demand. By creating a valuable product, you create new demand for product(s) of comparable value to what you’ve made. This happens because your product is quickly sold, giving you and your workers money to buy other products with. Because of this, a “general glut” of goods should never occur.
With the onset of the Great Depression, the unemployment rate rose to a peak of 25%, leaving large amounts of labor unused. This caused products to remain unsold, in many cases, in what was apparently a general glut. The unemployed just didn’t have the money to buy those goods. Say’s law implied that what economists were observing couldn’t occur, in the same way that the ether implied that what Michelson and Morley observed couldn’t occur, falsifying it.
Economists began to change their minds. New ideas were provided by John Maynard Keynes in his General Theory of Employment, Interest and Money. This was later summarized mathematically by John Hicks and Alvin Hansen as the IS-LM model. That would take time to explain, but for now, it’s good enough to tell you the key idea: supply doesn’t create its own demand if there isn’t enough money to go around. The Federal Reserve, which controls the money supply in the United States, played a big role in causing the Great Depression by lending to banks at high interest rates (in other words, by making money expensive and scarce). The Fed also played a big role in stopping a second depression in 2008 by expanding the money supply, though the combined response of the Fed and Congress was insufficient.12
Here’s economist John Kenneth Galbraith describing the change:
Until Keynes, Say’s Law had ruled in economics for more than a century. And the rule was no casual thing; to a remarkable degree acceptance of Say’s Law was the test by which reputable economists were distinguished from the crackpots. Until late in the ’30s no candidate for a Ph.D. at a major American university who spoke seriously about a shortage of purchasing power as a cause of recession could be passed. He saw only the surface of things, was unworthy of the company of scholars. Say’s Law stands as the most distinguished example of the stability of economic ideas, including when they are wrong.
Here, Galbraith seems to be disagreeing with me. I think he may have been right to say that ideas in economics are stable even when wrong, but this doesn’t seem to be exceptional about economics. Physicists believed in the ether for centuries, despite it being completely unobservable and non-existent. I don’t blame physicists for this failure because the work of physicists, like the work of economists, is difficult. Interestingly, economists give far more respect to the field of physics than they get in return. Supply really doesn’t create its own demand.
Some old ideas in economics remain pervasive today despite their rejection by economists or their weakening. The efficient-market hypothesis (EMH) is one example, stating that asset prices reflect all available information. This means, for example, that if you see a headline from yesterday about how Apple had an unusually good financial quarter, buying stock in Apple will do you no good: the price will have already risen to compensate for the greater expected profits.
The EMH received a great deal of support from economists like Eugene Fama, who noticed that stock markets follow an unpredictable random walk in the short run, consistent with the EMH. This is still a good way to think about financial markets, and you should never expect to easily beat the market, or even to beat it with a great deal of effort. But the EMH has been weakened by empirical evidence. S. Francis Nicholson, for example, noticed that financial analysts generally believed that stocks with high price-to-earnings ratios would perform better, but the opposite is true in practice. I would assume that this caveat has become so well-known that you can no longer make money by buying stock in companies with low price-to-earnings ratios, but I may be wrong.
There are plenty of people who want the field of economics to change faster and accept their ideas, and I can’t address all of them at once. Let’s focus on just one direct challenge to the field of economics: that globalization has failed to produce the results economists promised and has instead brought misery and decline. This is not an example of an area where the field needs to change, but instead an example of how difficult it is for the field to communicate to outsiders.
Anti-globalization rhetoric often includes a broader form of rhetoric I like to call real income denialism. At any given point in time in American history, you can rank Americans by their income and take the income of the person in the middle to get the “median” income. The average price level tends to rise over time, so we need to adjust for purchasing power with an index of the price level to learn about how incomes have changed over time. We call incomes that have been adjusted for inflation “real” incomes. To give a mathematical example, if incomes grew by 40% over a period while the price level rose 30%, dividing incomes by our index will tell us that real incomes grew by about 7.7%.
Here is what the real median personal income looks like over time in the United States:

Plenty of people have struggled in the American economy and continue to. I don’t mean to say they don’t exist. But economists expected that, and only suggested we would see continued growth, as shown above. The 1992 edition of Paul Samuelson’s introductory economics textbook includes this line:
If free trade increases the supply of goods that are produced by particular factors of production or in particular regions, those factors or regions may end up with lower incomes than under restricted trade.
Here, he’s using the term “factors of production” to refer to anything used to produce things, including labor. So, economics students in the early 1990s already knew that the costs and benefits of a free trade agreement like NAFTA would be uneven.
I’ve written extensively to try to show that living standards have risen in the US, and others have done so too. The waves of bad ideas on this subject are hard to fight because you can always nitpick the parts of the economy that have gotten worse and subjectively overemphasize them, instead of weighing them in proportion to their share of spending, as economists do with price indices like the CPI. It’s also easy to lie with pictures:

Any narrative that describes the country as being in material decline is simply wrong, but that’s not the lesson here. The lesson is in Samuelson’s 1992 textbook: economists knew what would go wrong before it went wrong. The mistake, if any, was expecting (or hoping) that American institutions would compensate the losers.
In general, economists have been responsive to new evidence, albeit slowly. Their stubbornness doesn’t appear to stand out in comparison to that of other fields. You can find plenty of examples elsewhere, like how biologists believed in spontaneous generation (the idea that life generates spontaneously from non-living matter) for thousands of years before tests proved it wrong. If there’s any truth to the idea that economists are unusually stubborn, it’s mostly in the inherent difficulty of doing science.
It’s especially difficult to communicate science to outsiders. Laymen seem to believe that economists think tax cuts raise government revenues; really, economists have been trying to get people to stop believing this for some time now. Here’s a Kent Clark Center survey from 2012 where zero economists agreed that cutting the top tax rate would raise revenue.
I could spend endless time trying to give more examples of ideas in economics changing over time, like how Malthusian ideas accurately described the economy before the Industrial Revolution, only to be proven wrong by rapid population growth and simultaneous increases in living standards. But I think it would be better to move on to a more interesting problem.
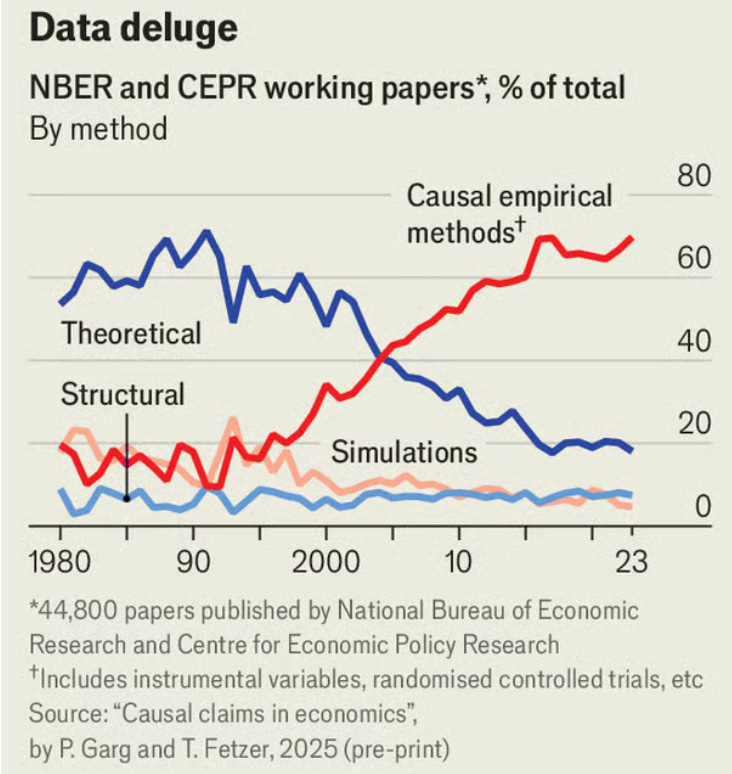
Are linear regressions meaningful?
Linear regressions are foundational to how economists test their ideas, as seen in the previous post in this series. More specifically, empirical methods like a multiple linear regression with an instrumental variable now make up 70% of the methods applied in NBER and CEPR working papers, as shown earlier in this chart:

I’m sure most would agree this is a positive change. But in the previous post, I included the image below and asked whether it could be considered meaningful.
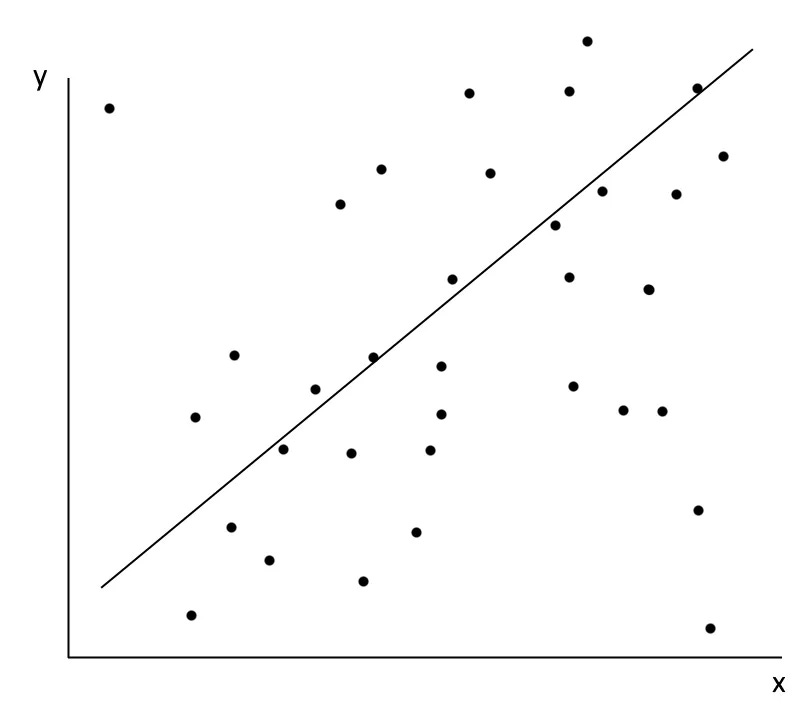
With a simple linear regression, we’re trying to model a complex world using a model that tries to predict y-values using only x-values, even though lots of things affect y, and x might even affect y in different ways if other things are different. Here, I would like to provide an example where this works. This should show that linear regressions can be meaningful even in a complex world.
Earlier, I brought up Newton’s second law of motion, F = MA. If you created a Newtonian physics regression, it might look like “A = β*F” where β is just some number we’re looking for called a coefficient, which tells you how force affects acceleration. To estimate the model, we keep punching things and checking how their position changes, measuring their acceleration. Once we’re done, we find that β is some positive number, meaning that more force F is associated with more acceleration A.
Clearly, we’ve lost the plot. Mass should be featured in our formula, too. But something good has happened: we found that force increases acceleration, even though reality is more complicated than that. In truth, β = 1/M, which is not a constant, so we could never identify it by estimating a line. But 1/M is always positive, so greater force always increases acceleration if mass is constant. We identified this correctly by finding that β is positive.
As long as the mass of the object we were hitting was unrelated to the force we were applying, we would come to the right conclusion. If we punched things harder when they were much heavier, we might have found that force seems to have a negative effect on acceleration, since heavier objects move more slowly than lighter ones if you don’t apply force proportionate to their weight.
This is the problem of omitted variable bias that economists try to avoid. We want unobserved things that also affect outcomes, like acceleration, to be unrelated to the things we’re curious about, like force. If they’re unrelated, we can get closer to the truth, even if it remains somewhat elusive. We can know that β is positive or negative, even if it’s determined by other things. So in theory, it really is possible to gain some knowledge about systems too complex for our understanding.
The things economists study are far more complicated than motion, and the methods they use are more complicated too. I think those methods, as featured previously, are very convincing and do a decent job of avoiding the problem of omitted variable bias. At the very least, they’re a great improvement over blind speculation or simplistic storytelling.
Consensus
“Astrology for men” is just one comment I’ve heard when talking about my college major. The other fairly regular response is actually a question: “What school of thought do you prefer?” or something like that. In the eyes of the less-than-fully-informed, economics is divided into schools of thought, including but not limited to classical economics, neoclassical economics, Keynesian economics, the Chicago school, Austrian economics, and perhaps Marxist economics. This makes the field feel more interesting and akin to astrology, or perhaps the Myers-Briggs Type Indicator, another form of pseudoscience.13
I think people enjoy receiving new classifications. It adds to their sense of having a unique identity and community with others like them. The same motivation might draw someone to, for example, a Buzzfeed quiz assessing which Harry Potter house they would be in. And I’m not against fun like this.
But I’m against misinformed ideas about economics, and economists generally don’t identify themselves with any particular school of thought. When they do, this signals only differences in framing, differences in focus, or a slight deviation from what most economists believe. I would provide a survey testing this idea if I could; unfortunately, you might only know the truth of what I’m saying by carefully checking the social media accounts operated by academic, PhD-holding economists.
There are no separate schools of thought that disagree on the most important issues. That is reflected in any review of Kent Clark Center surveys of economists or other surveys. The disagreements that do occur often have clear roots in the wording of the question and often appear small on review of the comments made by those surveyed. Major issues in economics, like whether the central bank should cut rates during a recession or the effects of tax cuts on government revenues, have little diversity of thought except on minor points. Economists will disagree on the precise revenue-maximizing rate of income taxation in a country without disagreeing that such a point is definitely less than 100%.
The most agreement occurs on points that feel too boring to mention, like how supply curves almost always slope upward. That simply means businesses in a competitive market are willing and able to supply more of a good if the price is higher. But these simpler points are more valuable than you might think. Evidence points to the same pattern with housing supply, with less housing being produced when prices are forced down, but surveys reveal people often don’t believe this, even when they believe it about other goods. It’s invaluable that economists agree on simple, essential facts like these, even if they’re simple and at first appear unenlightening.
It might be worthwhile to take a moment to look at the aforementioned schools of thought. Classical economics refers to the school of thought in political economy that prevailed in the 18th and 19th centuries, especially in Britain. Many of the ideas of classical economics came from Adam Smith’s book The Wealth of Nations, which still forms the foundation for much of modern economics. It included passages describing supply and demand as well as the need for government intervention in certain areas, like the provision of national defense.14 But as we saw, the Great Depression and other historical developments led to significant revisions in macroeconomic thinking associated with classical economics.
The Austrian school of economics has its own share of contributions to the field, such as Friedrich Hayek’s famed paper The Use of Knowledge in Society describing how, by happy accident, free markets and prices are able to solve the problem of allocating resources based on knowledge otherwise unavailable to a central planner. A central planner, for example, might not know that it would be more efficient to repair a cottage with wood nearby than with concrete from miles away. Prices paid by the cottage owner for wood and concrete make the problem obvious. I rewrote and annotated the entire paper for greater legibility on this blog.
The Austrian school also included advocacy for the gold standard, in which the value of currency is tied to gold by a government promise to provide a fixed amount of gold for every unit of currency. Zero economists on the Kent Clark Center’s panel agreed that a return to this system would improve price stability or employment outcomes for the average American. The problems with the gold standard can be read about elsewhere (an argument from authority like this is a useful indicator, but it isn’t conclusive); the point is that economists did not adopt this particular position that some Austrian economists, in particular Ludwig von Mises, believed in.
Including Marxist economics as a school of thought in economics seems to be a category error. There is no school of thought based around Marx providing answers to most of the questions of concern to modern economists, like “Do minimum wage hikes affect unemployment?” or “Does nominal GDP targeting improve the ability of central banks to provide price stability and mitigate recessions?” Marx also never directly addressed the question of whether there should be a gold standard.
Solving empirical problems mostly requires good econometric work, and the Central Limit Theorem remains true regardless of your thoughts on Marx or the importance of class conflict. Marxists provide a larger narrative of historical progress, but economists are mostly disinterested in long-term historical patterns.
Here is economist Robert Solow, famed for the Solow model of economic growth, describing the issue:
Economics is likely to be contaminated by ideology. For this reason, there are always dissenting fringes within academic economics. Marxism is only the most persistent. There is an Austrian persuasion (a sort of extreme individualism), there are post-Keynesians and neo-Ricardians, and there are many other people who just don’t like what is going on in the mainstream. Nevertheless, there is usually a definite consensus—there is one now—and an accurate picture of the discipline would make that clear.
Of great relevance is the 1995 article “Where Is There Consensus Among American Economic Historians? The Results of a Survey on Forty Propositions”. Those surveyed were randomly selected from the Economic History Association. Two-thirds disagreed that the gold standard was effective at stabilizing prices and moderating business cycle fluctuations during the late 19th and early 20th centuries, with one-third agreeing, mostly “with provisos”, i.e., with conditions attached to their agreement. This contradicts what I said earlier somewhat, but this is also a historical observation rather than a suggestion about what should be done today.
Notably, they overwhelmingly agreed that the passage of the Smoot-Hawley Tariff Act exacerbated the Great Depression, with 86 economists agreeing and 14 disagreeing. The idea that the field is divided into schools of thought might lead you to the mistaken belief that economists would be split on issues like these, perhaps with Keynesians supporting the passage of the act, or some other division I couldn’t conceive of.
I’m not sure what, exactly, fuels ignorance on this issue. It may be that people expect too much of economists. Similar problems would arise if you had similar expectations about physicists, hoping they agree on every question you care about, rather than just those they have extensively studied. I would not consider physics to be less meaningful if physicists disagreed about whether the universe is a mathematical structure, as hypothesized and advocated for by physicist Max Tegmark, or if they disagreed about whether that is even plausible.
Some might still be annoyed by the contrast between what I’m saying about the scientific nature of economics and the disagreement the field clearly has. If you asked 100 physicists whether hydrogen bonds explain the surface tension of water, it’s unlikely that 14 of them would disagree.
The real problem is that political systems create a natural tendency for the issues of most concern to people to become those most difficult to solve, unlike other fields. Whenever governments are considering passing a bill into law, they weigh the costs and benefits. The US government considers an odd reweighting of the costs and benefits of a policy to the country as a whole, with less-populated states receiving more influence, for example. But in some cases, the benefits of a particular policy are so clear and so broad that it is quickly passed into law and never touched.
One good example is national defense. Very, very few people in the US spend time discussing the abolishment of the military. Economists have a clear explanation for why: the military provides a public good, national defense, which would not be provided if not for its existence, due to the free-rider problem. Without government funding, the military would struggle to convince people to pay them voluntarily, since everyone would prefer to let others foot the bill. So the military has always been there, and while its funding as a share of GDP has fallen slowly for decades, it still remains. Any other policy with such clear benefits receives the same treatment. On these issues, few people ask economists for their opinion or look for a consensus.
Compare this policy to the minimum wage. Rather than benefiting everyone, the policy has clear winners and losers. The winners are most workers, while the losers are the seemingly few workers who are left unemployed as a consequence, and the businesses who have to pay more for labor. It should be expected that at times economists disagree on the exact costs and benefits of the policy and whether it is good on net. What’s unexpected is the level of agreement they really do have at times, with, for example, only one economist among 42 agreeing that raising the federal minimum wage to $15 per hour would substantially increase aggregate output in the US.15 Issues like the minimum wage, with winners and losers and complicated effects, are the issues the public most wants economists to provide clear answers and recommendations for.
Other sciences generally don’t suffer from this problem. There is not much of a natural tendency for public attention to be pushed to the most difficult to resolve issues in physics, zoology, paleontology, or almost any other science. People are happy to enjoy fun science videos about physics concepts established a century ago, and expect only that the laws of physics don’t suddenly fail while a plane is in flight. They don’t think very often about the reason why practically every government redistributes income when charity exists.
If the most elementary and well-agreed-upon ideas in economics were as interesting as those in physics, it might not be considered so easy to dismiss. Compare the equation of exchange in monetary economics, MV = PQ, to Newton’s first law. Newton’s first law tells you that an object in motion stays in motion, and it’s surely obvious to physicists. Despite this, people are still amazed and confused when confronted with a situation where a man jumps on top of a moving vehicle.
It would be helpful for people to know that P = MV/Q, i.e., the price level is strictly determined by the money supply, the rate at which it changes hands, and how much we produce. This is an accounting identity, a tautology in the terminology we introduced earlier. Almost nobody outside of economics can give you this formula from memory. They do know that inflation was unusually high during the Biden administration, and expect economists to have known this would happen before the Biden administration’s legislative agenda was passed. To create an analogy to physics, you might as well expect them to know the location of the jumping man after five seconds while only knowing the force of the jump and the weight of the man without the direction, speed, or pressure of the wind.
By this point, I think we’re ready to move on to the next section. But if you still aren’t convinced, you can examine the contents of this paper, “Views among Economists: Professional Consensus or Point-Counterpoint?” by Roger Gordon and Gordon B. Dahl:
Based on our analysis, we find a broad consensus on these many different economic issues, particularly when the past economic literature on the question is large.
Perhaps the most relevant section:
The first question we face in the analysis is how to define differences in views among our panel members. Consider for example the responses to the question asking whether the Fed’s new policies in 2011 will increase GDP growth by at least 1% in 2012. The responses were 41% “uncertain”, 37% “disagree”, and 17% “strongly disagree”. Initially, we assume that these responses imply consensus, since no respondents “agree” even though respondents differed in their extent of disagreement with the statement.
By this definition, there is an extraordinarily high level of consensus among our Panel members. Only 6% of the responses in our data violate this definition of consensus, responding “disagree” when the consensus is “agree”, or conversely. Similarly, for 32 out of the 80 questions, there are no such disagreements.
Scientific norms in economics
If you are especially cynical about science, you might prefer the sociology of science to the philosophy of science. Rather than asking what makes something scientific, sociologists focus on the behavior of scientists and the way they interact with each other. From their perspective, it might be that what matters in comparing economics to other forms of science is comparing the norms that prevail among economists to the norms that prevail among chemists and physicists. This also leads us into some additional criticisms one might have of the field.
According to sociologist Robert Merton, the norms that govern scientific communities are universalism, communism, disinterestedness, and organized skepticism. We’ll look at each in turn.
Communism
Ironically, this is the one norm described by Merton that seems to clearly apply to economics and just about any other field. Communism is the norm of common ownership of ideas and results, and clearly, there are few restrictions on the ideas and results you can use for doing economics. Supply and demand was never owned by Adam Smith, and you are free to cite Daron Acemoglu as many times as you’d like. I don’t think I need to spend more than a paragraph talking about this. There are exceptions, like proprietary data, but I rarely hear about difficulties arising from a lack of idea communism.
Organized skepticism
Organized skepticism is the second least restrictive of the norms and refers to the norm of scientists continuously questioning each other’s results. David Card’s study of the Mariel boatlift of Cuban immigrants into Miami provides us with a good example. Card found that immigration had no effect on wages there, but Labor economist George Borjas criticized and reappraised Card’s study, writing a paper reanalyzing data on wages in Miami. He found that “The wage of high school dropouts in Miami dropped dramatically, by 10 to 30%, suggesting an elasticity of wages with respect to the number of workers between -0.5 and -1.5.” This was then followed up with another paper about the same event from Giovanni Peri, finding no such impact. Economists are bickering types, which is very good for hunting down the truth.
I could also point to Card’s study of the minimum wage hike in New Jersey and the response from Neumark and Wascher, but further examples would not really prove the rule. Without somehow taking a random sample of all papers published in economics and checking whether they faced serious criticism, one can’t really know whether organized skepticism prevails, except by slowly gaining confidence that it does as you study the field. I have a lot of confidence in it now.
Universalism
Universalism is the idea that the personal attributes and social background of a person shouldn’t influence the value of their ideas. More generally, ideas are valuable only for their content. One way we might check to make sure a field is universalistic is by looking at the diversity of its most celebrated thinkers. The problems with doing this come from a couple of forms of omitted variable bias: first, competency is weakly correlated with demographic characteristics, so we should expect some demographics to show up disproportionately often, and second, demographic characteristics are correlated with one’s choice to enter a field, resulting in the same pattern. So it’s worthwhile to look at more serious work on discrimination within the field of economics rather than gazing directly at its very white, male, wealthy makeup.16
To make this simple, I’ll compare discrimination within economics to discrimination within the sciences as a whole. If you can tolerate the scientific status of most of the sciences in spite of some harmful forms of discrimination, showing that discrimination within economics is not much worse or better should show you that this is not a useful point to make against economics in particular.
This is an area where economics seems to do well. A 2023 article in PLOS Biology, a peer-reviewed journal, looked at millions of authors to measure how much more frequently men are cited than women across many scientific disciplines. In their sample, there were 1.88 times as many men among the authors analyzed as women, and there were 3.21 times as many men among the top 2% of authors by citations. They found substantial differences between fields, with men showing “more than 3-fold relative overrepresentation among top-cited scientists than in the overall count of authors” in economic theory and econometrics. These are only two subfields of economics, so it’s not clear what the field as a whole looks like, but this is a bad sign.
A similar result was found by Erin Hengel in 2019, with male-authored papers in economics getting cited more often.17 However, Hengel found that this was driven by a small number of highly-cited papers from Nobel winners written in the 1980s. Once these outliers are removed, “female-authored papers are actually cited more.”
But it’s not all sunshine and roses: the author had previously found that women seem to be held to higher standards in the peer review process, explaining both their underrepresentation in economics journals and their greater likelihood of getting cited. Women also appear to be viewed differently in economics, with letters of recommendation for women economists18 being more likely to include language describing the economist as hard-working and less likely to include language describing them as having great intellectual ability.
There are substantial problems of bias, but I have hope that things are improving. That this work is being done at all is a good sign. One of the more recent Nobel prizes in economics was won by a woman, Claudia Goldin, “for having advanced our understanding of women’s labour market outcomes”. We’ve also seen that any rejection of economics on this basis would reject other sciences as well; for further evidence, consider the great underrepresentation of women among winners of the physics Nobel. I would write about discrimination against ideas in economics on other (irrelevant) bases if I had more time, but there’s too much to talk about.
Disinterestedness
Disinterestedness is perhaps the most idealistic of the norms Merton described. It’s the norm of acting for the benefit of a common scientific enterprise rather than your own personal gain. I’m not sure how important this is to the validity of ideas within a field, but I should at least talk about it a little.
Economists would be the quickest of all scientists to counter that this is unnecessary for good results in the aggregate. Like I described before, the field has its roots in Adam Smith’s The Wealth of Nations, which celebrates the “invisible hand”, a metaphor for how people help one another through mutually beneficial exchanges when they are constrained by private property rights.19
Interestingly, philosophers of science have expressed similar views about the sciences. Philosopher Thomas Kuhn, famous for his ideas about science evolving through paradigms, also wrote about how scientific progress can occur even if individual scientists are narrow-minded and dogmatic. This is not quite the same as self-interested scientists creating a disinterested community, but it’s analogous.
Do economists act for the benefit of science rather than their own personal gain? I think it’s both. When the two come into conflict, I suspect there are problems, but practically everything I’ve written about can be taken as good reason to believe they act for the benefit of science anyway. By happy accident, the parts of this post about evil statistical techniques and fraud succeed this one and will help you decide whether economists are remarkably selfish and non-disinterested.
P-hacking
They aren’t. Here’s a chart that makes me especially proud:

The concept of a p-value was explained in the previous post, but I’ll provide a reminder: a p-value tells you the probability of observing an effect as strong, or stronger, than the one you observed if you assume there is no effect at all. Probabilities like this exist because there is random variation between people unrelated to whatever treatment we look at, whether a drug or an economic policy, and that random variation might just happen to make the treatment look effective when it isn’t.
Unfortunately, scientists sometimes do something called p-hacking, where they repeatedly look for relationships in their data and only report the relationships with a low p-value. Another way they might p-hack is by looking for relationships as they collect data and only stopping when they get a significant result.
The problem with this practice might not be obvious, so think, for a moment, about a p-value of 5%. That tells you that the observed relationship, or a more extreme one, would occur 5% of the time by random chance if there were no relationship at all. If you looked at 20 non-relationships with a random sample, you would expect one of them to seem like it’s there just by random chance.20 Hence, you can acquire a fake relationship by repeatedly testing a sample for relationships until you get lucky. Drop the results with large p-values, and you’re on your way to getting published in a scientific journal.
All of this is just to say that if some sciences are healthy and others are not, we expect the healthiest sciences to have few results with tiny p-values. The graphic shown above tells you that, from this perspective, economics is actually the king of the sciences: just 12.79% of p-values in economics papers had a p-value in the range of 0.05 to 0.01, at least in the sample used to make the graphic. Most other sciences had p-values in that range more than three times as often.
We’d really like to know how often p-values would fall in the range of 0.05 to 0.01 if there were no p-hacking, but that’s not something we can find out. You would need information about the existence of true relationships in general.
The previous post covered some impressive methods for identifying the causal effect of variables of interest, like the rate of immigration. These are very important to modern economics. Randomized controlled trials (RCTs) are the simplest and weren’t featured in the econometrics section for that reason. With an RCT, researchers randomly assign a treatment to see if it works, like randomly providing people with a diabetes drug, or in economics, a small loan. You can then compare the treated to the untreated to see what effect the treatment has. Much to the disappointment of economists, governments are as of yet unwilling to determine their policies randomly, so RCTs can only be applied to relatively boring issues.
Below, you can see the distribution of z-statistics for four of these different methods. Z-statistics are like T-statistics, explained in the previous post in this series, except they use the population standard deviation rather than an estimate of it. If you don’t know what all of that means, just think of them as describing the size of an observed effect in a standardized way.

These standardized effect sizes seem to cluster around a z-statistic of 2. If you assume that there is no effect, an effect size greater than 1.96 will occur less than 5% of the time. This arbitrary number is often used by scientists to decide whether a relationship counts as “statistically significant”, i.e., sufficiently strong that we don’t think it’s too likely to have occurred by random chance if it weren’t really there. So it’s very bad that results are clustering around this arbitrary value: somebody is messing with the results.
Multiple things could be causing the problem, like researchers p-hacking or publishers refusing to publish null results (results that aren’t statistically significant, in which we fail to reject the null hypothesis of no relationship). In a moment, we’ll take a closer look at who the real troublemakers are.
Why Most Published Research Findings Are False (and why most things researchers believe are true)
In 2005, John Ioannidis published “Why Most Published Research Findings Are False”, which remarkably found that even a small amount of bias among researchers dramatically increases the rate of false positives. A false positive is a result that indicates that there is a relationship between two variables, even just a simple correlation, when there is none.
This is the key formula in his paper:
This describes the “positive predictive value”, meaning the share of relationships we consider to be true relationships that are actually true. Remember that with the tests for statistical significance I’ve been talking about, there’s a chance that a relationship appears true when it’s just an artifact of random chance. That’s called a false positive, the presence of which is what the PPV is all about—we could just as well define it as “1 minus the fraction of relationships that are false positives.” Given certain assumptions, this formula is a correct description of PPV, since it’s derived from Bayes’ Theorem, a (true) result from probability theory.
Let’s see what those variables in the formula mean. β refers to the probability of a false positive result, so (1 - β) is the probability of a true positive result, also known as the “statistical power” of a study. α is the statistical significance level used, typically 0.05. “R” is where this formula becomes questionable. It describes the ratio of true relationships to false relationships before we perform any studies. We usually don’t know what this is.21 We can check different values of R and see what happens to PPV, as Ioannidis did, but we can’t know the real ratio.
Ioannidis modified the formula to account for researcher bias. It can be shown22 that, if the proportion of relationships we investigate and only find to be true due to bias is “u”, then the formula for PPV is
This is probably the scariest formula I’ve featured on my blog, and it shouldn’t make any intuitive sense to you. Sorry.
The bias term in the numerator actually raises the PPV. This is because researcher bias causes some false negative results (where we reject a relationship when it really does exist) to become true positive results. The terms in the denominator lower the PPV and describe cases where additional false positives are created by researcher bias. Naturally, this makes things worse overall.
Here is a table from Ioannidis’ paper, describing the PPV for various combinations of power (1 - β), R, and u.
These are worrying results, of course. If Ioannidis is right, most of the relationships described as true by meta-analyses of small, inconclusive studies are not actually true. In general, unless you have high power, high R, and low researcher bias, most “true relationships” are not really true.
I’m not a fan of assuming these choices for R are reasonable, so let’s just pick some reasonable levels for (1 - β) and u and graph PPV as a function of R. For our choice of power, let’s take from Christensen and Miguel’s “Transparency, Reproducibility, and the Credibility of Economics Research”, which I relied on greatly to write this part. They wrote that “Doucouliagos and Stanley (2013); Ioannidis, Stanley, and Doucouliagos (2017); and others have documented that many empirical economics studies are actually quite underpowered” and that a more realistic level of power is 0.5. Let’s be extremely pessimistic with our choice of u and use 0.8.
Here, the horizontal axis is the prior ratio of true relationships to false relationships. The vertical axis is the PPV. The result on the far right tells you that if we’re very confident the relationships we’re looking at are true at 10 to 1 odds, even a lot of bias doesn’t kill PPV. If instead we’re looking at relationships we’re 75% confident are true, PPV falls to about 76%. At 50% odds, PPV is about 51%.
Noticing a pattern here? All you’re observing is how PPV tends to be slightly higher than our prior odds, described by the curve R/(R+1). We necessarily improve on our previous level of confidence by adding more information, but Ioannidis noticed that we don’t improve much.
Now let’s look at different variations of the PPV formula.
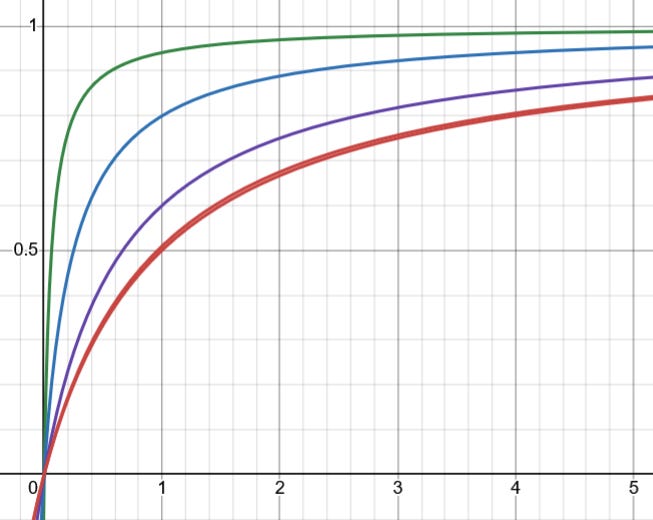
The two red lines are the prior odds, at the bottom, and the PPV formula (also known as the “posterior odds”) just above it. Each of these lines makes some amount of improvement on our prior knowledge. It seems that adding in scientific knowledge doesn’t make much of a difference in our beliefs under our pessimistic assumptions, which create the higher red line. We’re stuck close to our prior odds for the relationships we’re looking at.
If you lower researcher bias u to 0.2, rather than 0.8, we get the purple line. At 1-1 odds, this line hits 0.6 exactly, meaning 60% of relationships with 50% prior odds that appear true are actually true. To get to something like the blue line, you can either remove researcher bias entirely or only look at studies with statistical power at or above 0.8. The green line is what you get by adding both of those things to the purple line—a highly optimistic scenario where we jump from 50% prior odds to ~90% odds after a study saying the relationship is true.
Ioannidis provides an example where researchers are testing 100,000 gene polymorphisms for an association with schizophrenia. Before studying these genes, he wrote, we have no idea which ones are associated with schizophrenia. So if we expect ten genes to be associated with schizophrenia based on our prior knowledge, R is an extremely tiny 10/100,000, or 10-4. If we find an association between ten genes and schizophrenia, we’ll still improve very little on our prior odds, and PPV will be near zero. You can see this in the graph through how the lines behave when R is near zero.
But this kind of thinking gets especially funny with economics. Should we really think, before doing any testing, that it is unlikely that the law of supply is a real law, i.e., that R < 1 for the law of supply? You have to have some unusual and strangely confident suspicions about human behavior to reject economic relationships like this. In any case, including R in our judgment of economics makes our task appear much more subjective.
Truly, the problem with Ioannidis’ paper is that the scope of his title exceeds the scope of his evidence. “Most published research findings are false” suggests that most of the things doctors believe are false, antibiotics don’t work, you shouldn’t get vaccinated, etc. But what Ioannidis was showing is that exploratory work, where large numbers of tests are performed, is unlikely to lead to correct conclusions. Scott Alexander has a post where he explains this, and really, you should just go read that instead of asking me to continue paraphrasing it.
But to connect this back to economics, we would expect Ioannidis’ paper to be applicable to economics if economists were testing large numbers of solutions to poverty. That might sound something like “Here, you guys get $1,000, you guys get a training course in Python, all of the women will be instructed to dress like butch lesbians, the next group gets nice suits to do well in their interviews…” Some of these solutions would have high prior odds, but others wouldn’t, and most of our positive results would probably have occurred by random chance.
But this isn’t how economists do their work. Usually, the prior odds are fairly high because we’ve already observed a lot of evidence in their favor, like with the law of supply, which is primarily supported by the (very obvious) idea that people prefer more money to less.
In modern economics, we test things like this with natural experiments, as described in the econometrics portion of this series. Then we test them again, and again, and summarize all of the available evidence, as shown in that plot of minimum wage research where the employment effects tended to be negative. Then we summarize it again, because I guarantee you that for any significant question in economics, there are multiple literature reviews telling you what we know, and they pretty much say the same thing. Here’s another minimum wage literature review, from Arindrajit Dube (he has a substack!) and Attila S. Lindner:
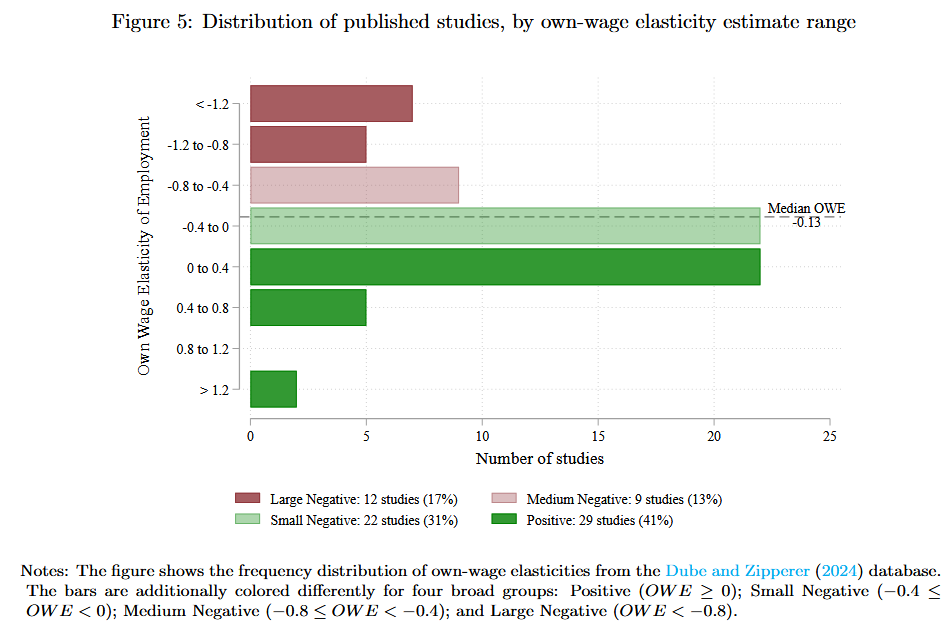
Even while pointing to these exceptions to the Ioannidis paper, I might be too generous. John C. Ashton, writing in Medical Hypotheses, noticed that the Bayesian model used by Ioannidis is incoherent. R is the share of all relationships that are true prior to a study taking place, but it’s incoherent to suppose we can know what “all relationships” means:
To estimate R it is necessary to first estimate a denominator defined by the set of possible hypotheses in a field of enquiry (the numerator will consist of the true hypotheses within that set). But what is this exactly? Is it all conceivable hypotheses? This cannot be correct because such a set would be infinite. Perhaps then it is all hypotheses that are actually investigated? But how is this defined, by all hypotheses that are thought through and written down? Or is it restricted to all those hypotheses that are communicated to others? Or, to those that undergo some preliminary experimental investigation, such as the tinkering that goes on prior even to something as formal as a pilot experiment? Or, only hypotheses that are subject to a fully planned NHT experiment?
Bayes’ theorem is very useful when it’s clear what the prior odds are. Suppose, for example, that we’re flipping a coin blindfolded. If it lands on heads, it’s guaranteed that we’ll hear a “ding” sound. If it lands on tails, there’s a 50% chance we hear the ding. Bayes’ theorem tells us how to calculate the probability that the coin landed on tails if we hear a ding sound. In this case, unlike our previous cases, it’s obvious that the prior odds (R, or in this case P(tails)) are 0.5, because heads and tails are equally likely:
Now you might be even more confused because there’s notation here you might not be used to. “P()” indicates the probability of something—you might remember Steve Carell referring to “P doom” in Mountainhead, meaning the probability the world ends. The symbol “|” should be read as “given” as in “given some evidence”.
This clean mathematics doesn’t translate too easily to the real world. It probably applies in the exploratory example Ioannidis gave involving genes, but it’s not obvious how it works in most other cases, including in economics.
In some cases, we can fix the problem by applying the tool of confidence levels I introduced earlier. Suppose that a country is considering the introduction of a new economic policy, which we’ll call the turtle policy. Researchers have decided to get to work on this issue to check and see what effect it might have on the turtle population. If we want to know the prior odds that it increases the turtle population, it’s not clear where those could come from.
But at the very least, we can use good incentives to create good prior odds. A private company calling itself Policymarket opens a betting market on what will happen to the turtle population if the policy is introduced. Because you only profit by being right and lots of money is on the line, this market integrates all publicly available information on what the turtle policy will do, and is drawn towards the most well-adjusted prior odds for the study. Anyone with information the market doesn’t have could make money by betting and drawing the market towards their own odds. Once they’ve bet as much money as they can, they’re even incentivized to immediately give that information away so that the price of their contracts goes up and they can cash out early.
The prior odds that result from this betting market might be 80%. These odds still have the problem of being mysterious, like before, because we don’t know what the ratio of true relationships to all relationships is. But it’s still true that in betting markets, things they say happen 80% of the time really do happen 80% of the time. So it’s perfectly sensible for the researchers to come out and say, “Given the statistical power of the study we did, an external estimate of how biased we are, and the prior odds from Policymarket, the new odds the turtle policy works should be 85%.”
I’ll finish this section with what is still a fairly serious problem, but not a fatal one: papers that don’t find relationships are less likely to be published. That means that any collection of economics papers investigating a relationship is biased towards finding one where none might exist. This is visible in the Time-sharing Experiments for the Social Sciences, a group of studies with the same source of funding, all of which were tracked with a lot of detail. Remarkably, two-thirds of cases where researchers failed to reject the null hypothesis of no relationship didn’t even get written up, and only a fifth got published:
It seems like getting a null result shouldn’t make something less likely to get published. After all, knowing there’s no relationship is still knowing something. But I don’t think this is necessarily true. It’s definitely true that getting a null result shouldn’t cause a paper to go unpublished. But the strength of the relationship is likely correlated with other things that should affect whether something is published. Studies that find weak relationships probably tend to have small sample sizes and sloppy measurements, meaning relationships are less likely to be significant and will be biased towards zero by attenuation bias. Plenty of other good reasons to avoid publishing something with a weak result exist.
There are also bad reasons to publish a null result, as described in Christensen and Miguel (2018):
As an aside, it is also possible that publication bias could work against rejection of the null hypothesis in some cases. For instance, within economics, in cases where there is a strong theoretical presumption among some scholars that the null hypothesis of no effect is likely to hold (e.g., in certain tests of market efficiency), the publication process could be biased by a preference among editors and referees for non-rejection of the null hypothesis of no effect.
If we lived in a world where null results are just as likely to get published as any other, we would probably be hand-wringing about excessively tolerant scientific journals publishing studies with tiny sample sizes and measurement error problems, or journals that are biased towards finding no relationship because they don’t want people to think government interventions work. But we clearly don’t live in that world, because getting published is really hard, so I still suspect the rate at which null results are published is too low.
How to Build a Regression
A moment ago, I introduced the problem of p-hacking. One way you can do this is by running lots of different regressions with different “specifications” (sets of independent variables) until you get a statistically significant result. But because researchers might not know exactly which independent variables to include, it’s a good idea to run multiple regressions, so a balance is needed.
Economists only gained the ability to run incredibly large amounts of regressions with ease with the rise of powerful computers, leading to Edward Leamer’s 1983 paper “Let’s Take the Con out of Econometrics”.23 In it, he showed that if you vary the control variables used in a regression used to estimate the effect of death penalties on the murder rate, like the median income, you can get estimates as strong as 29 lives saved for each execution to estimates as bad as 12 lives lost for each execution.
There are multiple ways to solve this problem of “model specification”, or deciding which variables to include in a regression. Here’s the slide describing how to do this from the applied econometrics class I took as an undergraduate, taught by Professor Mahmud Yesuf. It should give you a pretty good idea of what people are taught today.
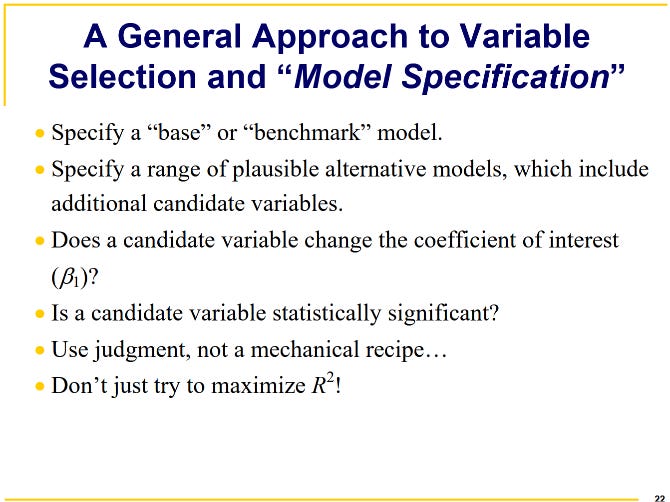
The professor stated that the base model should be based on economic theory. This is a pretty good recipe for success, especially because it discourages students from trying to maximize R2, which would probably lead them to include as many controls as possible. That may or may not be a good idea, as we just saw (doing so could put you on either side of zero, like in the example from Leamer).
The next slide in the deck provides an example of a typical, modern table of regression results with multiple specifications, just as Leamer hoped people would include, rather than picking the regression with a significant result and reporting nothing else. So it seems the field and its professors are very attentive to criticism.
The solutions presented in Christensen and Miguel (2018) are more interesting. Leamer and Leonard (1983) encourage researchers to create composite control variables made of multiple controls that they doubt the relevance of. They can then vary the weighting of different controls in the composite and see how that influences their results. This may be a little mysterious-sounding if you don’t know what a weighted average is, but simply put, this is a way to check the results from a lot of different specifications in a mathematically simpler way.
Far more interesting is model averaging, because it’s obscenely simple. Estimate the effect you’re interested in, β, under different specifications. Then take the weighted average of those effects, with the plausibilities of the models (“research priors and goodness-of-fit criteria”) acting as the weights. Here’s our beautiful formula:
This does exactly what I just described. The delta on the left is the estimated coefficient, with the “M” indicating the space of plausible models. On the right, you take the sum across the list of statistical models, with the total number being m.
μ(m|D) is the probability that a model m is the true model given the data D, and the final delta is the coefficient estimated with a particular model m. This should be hard to make sense of if you haven’t worked with summation notation before; return to the previous post and use ctrl+f “summation” to find a review if you need it.
This is one of my favorite parts of the paper. I had already thought about how you might deal with the problem of not knowing which specification to use by taking an average of different coefficients found with different specifications. But I never expected that real researchers would do this, albeit in a more complicated way.
Transparency and Fraud
If the research methods of economists were fabricated, or just poorly described, their findings could not be replicated even with the same data. This kind of transparency is important in the sciences in general. Without it, other scientists cannot easily notice when a result was found by some mistaken application of a data analysis tool or some other method. They also can’t easily try to falsify the results. So if economics is to be scientific, economists should be transparent about their methods and data.
Returning to our method of comparison, the bar is pretty low if you consider oncology to be a science. Consider these excerpts:
A cross-sectional analysis of a random sample of 306 cancer-related articles indexed in PubMed in 2019 which studied research subjects with a cancer diagnosis was performed… One in five studies declared data were publicly available (59/306, 19%, 95% CI: 15–24%). However, when data availability was investigated this percentage dropped to 16%, and then to less than 1% (1/306, 95% CI: 0–2%) when data were checked for compliance with key FAIR principles [like being posted to a recognized repository, a centralized storage system for data].
This is from “How often do cancer researchers make their data and code available and what factors are associated with sharing?” by Hamilton et al. I’m willing to excuse it a little because the most important way a result is replicated is by doing another study with new subjects, not by reusing the same data. But this is still worrying!
The “problem” in economics is not really a problem of no data sharing. As Christensen and Miguel described, in 1982, the Journal of Money, Credit, and Banking managed to squeeze data out of 78% of the researchers they requested it from in six months. In the no-request control group, just 34% shared. Given the way oncology research looks, this doesn’t look that bad. And in 2004, Ben Bernanke (a previous Federal Reserve chairman and then-editor of the American Economic Review) introduced a new policy of requiring data sharing from authors. Great as this was, in 2016, about 63.8% of papers with data were exempted from the requirement because their data was proprietary. This is probably necessary, especially since keeping data private is one way to make it more profitable and incentivize its collection.24 Tedersoo et al. (2021) found that data-sharing rates vary from 9% to 76% across journals and disciplines, so I don’t think you should be using this to determine whether a field is scientific.
Ok, but what about attempts at replicating previous results? Do those usually work? Work is scant, but it seems like it:
The original coefficients are normalized to equal 1. The replications are typically close to the original, and 16/18 of them had the same direction. Encouragingly, “studies with smaller p-values were more likely to replicate”, though it’s not clear which statistical test is referred to here to define replication.
This graph is a bit too optimistic; studies of replication generally find the rate of replication to be “relatively low”. But it’s notable that any replication occurs. We could always seek out whatever part of physics has the greatest difficulty with replication and criticize the whole field, but in either case, it’s better to look at the whole picture and ask if there’s any content that is consistently measurable. Supply and demand fits that picture nicely.
Anyway, the replication crisis affects many natural and social sciences, so I doubt this is the sticking point for people who think economics isn’t scientific.
Fraud
The importance of fraud rates should be obvious. If fraud were common in the field, there would be little empirical content to it, and every established relationship would be called into question.
So it’s worrying to see that 2 to 4% of economists have admitted to committing fraud in various anonymous surveys cited by Christensen and Miguel. They also noted that as of August 2016, the Research Papers in Economics plagiarism committee had found just 4 cases of fraud, but it’s not stated how many papers they checked. Judging from the cited webpage, these fraud cases were just the ones that happened to be reported by volunteers.
I’d like to mention at this point that I’ve drawn so heavily from Christensen and Miguel that it verges on plagiarism, but I can’t just tell you to go read it because it’s ~50 pages long and not everything in there is relevant. (Funnily enough, one of the irrelevant aspects I excluded was the part about plagiarism, since plagiarism is morally wrong but doesn’t make something unscientific on its own.) I’ve tried my best to combine paraphrasing with commenting in the same way I did in college to meet the standards of my professors.
It’s surprisingly difficult to find a comparison of economics to other disciplines in terms of fraud rates, but I did find this chart of academic misconduct retraction rates, taken from here (and recolored). The rates are per 10,000 papers and were found by taking the number of papers retracted for misconduct and dividing them by the total number of papers published in their sample.
As you can see, the social sciences aren’t stand-out champions of low misconduct, but they aren’t remarkably terrible either. They fall below the average and above the median rate.
There are various problems with this comparison. First, obviously we would like to separate economics from the other social sciences rather than assuming it isn’t too different. Second, we can’t expect different disciplines to put the same amount of effort into detecting fraud, so these rate differences aren’t too meaningful. If economists barely do anything to detect fraud and still come out above the median rate (probably, we don’t know because they’re grouped with other social scientists), that’s really bad. Finally, the chart looks at misconduct rather than fraud in particular, and like I said, plagiarism isn’t in itself unscientific. It’s just bad and ruins part of the incentive to create good scientific work—why bother with doing science if your work is going to get stolen and much of the rewards stolen with it?
Regardless, this is the best I can do. I don’t see why anyone would come to the conclusion that economics is relatively rife with fraud. Any argument against the scientific nature of economics on this basis appears to disqualify other important sciences as well.
Scientific Realism and Economics
We began by looking at economics through the lens of falsificationism, an influential solution to the demarcation problem, and saw that the field does a pretty good job of meeting that standard. It was shown that economics has a fair degree of consensus, and unlike other sciences, economists often deal with issues where acquiring consensus is hard.
We also saw that economists follow scientific norms. For example, economists are organized skeptics, questioning each other’s ideas and slowly adjusting their own over time. I covered some important challenges to economics and science in general, like the problem of induction and the application of Bayes’ theorem by John Ioannidis in an attempt to show that most relationships established in research papers are false positives. We also looked at the frequency of p-hacking and other forms of academic misconduct in economics, and saw some cause for optimism as well as skepticism.
But I haven’t introduced the most popular view of science among both philosophers and philosophers of science in particular: scientific realism. Peter Godfrey-Smith concluded Theory and Reality, on which much of this essay is built, by describing a form of scientific realism he endorses.25
Godfrey-Smith preferred to describe scientific realism with two things. First, it includes a belief in “common-sense realism naturalized”:
We all inhabit a common reality, which has a structure that exists independently of what people think and say about it, except insofar as reality is comprised of thoughts, theories, and other symbols, and except insofar as reality is dependent on thoughts, theories, and other symbols in ways that might be uncovered by science.
This seems right, but it should seem weirdly specific to you. There are two sentences about “thoughts, theories, and other symbols”. The first one is included because, obviously, languages are a part of reality, so we can’t say that reality is independent of what we think and say. By writing this post, I’ve modified reality just as I’ve talked about it. The second one is included because Godfrey-Smith worried about some controversial ideas involving quantum physics that might disprove the idea he’s given here if he didn’t include the exceptions.
Luckily, economics has no problem with common-sense realism naturalized. Economists will tell you that economics binds the wishes of political movements everywhere. There are no separate college courses for “Chinese economics”, explaining how Veblen goods don’t exist there, or a class on “German economics”, explaining how agglomeration effects in cities disappear once people begin to capitalize all nouns.
Second, the idea of scientific realism he gave includes this belief:
One actual and reasonable aim of science is to give us accurate descriptions (and other representations) of what reality is like. This project includes giving us accurate representations of aspects of reality that are unobservable.
“Actual” and “reasonable” are key terms here. It’s an actual aim of science because it’s something scientists really do, and it’s something I’ve done a lot to show economists are doing. It’s a reasonable aim of science because it’s possible to do it in principle. To better understand what’s meant by this, think back to the part about whether there are laws in economics.
But connecting this popular conception of science back to economics seems difficult. We can tell that a scientific realist who believes physics to be scientific considers electrons to be a real thing, or at least an attempt at describing a real thing. This can be contrasted with “instrumentalist” views of science, which claim that science merely aims to make predictions about the world using ideas that aren’t necessarily true. Milton Friedman held this view about economic theories, and I have oftentimes called on this idea as well to make people see how economic theory can be good even if you don’t believe it describes how people really behave. So clearly, if science is instrumentalist, it’s easy to defend economics as a form of science. But scientific realism might pose a problem. People are happy to point out that human beings are loving and generous as well as cruel and greedy, but homo economicus as presented by economists only appears greedy.
This is merely a problem of communication. Economists have done plenty of work beyond the simple models presented in introductory microeconomics classrooms. When I took labor economics, we looked at a fascinating paper showing that impoverishment causes property crimes. But that same paper showed that impoverishment seemed to cause less violent crime, probably because they were drinking less alcohol (the paper used the destruction of vineyards by a pest as an instrument for income changes). That doesn’t suggest people are perfectly rational, but they still got published and had their work taught at the LSE. On this blog, I’ve used basic economic theory to show why the love people feel for others makes charity a public good that the government should fund through welfare. Anyone who thinks economists believe people to be completely rational and selfish just hasn’t spent too long in the field.
The things economists really believe about people are as descriptive of the world as any scientific realist should hope for. Rather than believing people are perfectly rational, economists believe people are usually rational, as in the work of Daniel Kahneman. And rather than believing people are always selfish, economists believe people are selfish and kind, and that the selfish interests of people are easily observed in cases where they don’t butt heads with kindness. To give another example, there’s little reason to expect people to be so very kind that, when operating a gas station in a hurricane zone, they keep prices the same and sell just as much gas. That would require swallowing the extra costs of operation (e.g. paying more for truckers to bring the oil), effectively donating mounds of their own money to strangers until they run themselves out of business.
Wherever we look, and whatever standard we use, economics is scientific. Before ending the series, I’m inclined to write another post I’ll be releasing soon. I’ll argue that even if we seem to have come up short in many ways, with economics only providing generalities and having no hope of establishing laws, it’s far easier to argue that economics improves our knowledge of the world. I’ll also seek to explain why people are so eager to deny that economics is scientific. Until then, I think we can rest easy knowing that the methods are sound and the evidence is meaningful. Without it, we would be forced to do little more than sit around a campfire, telling stories in the economic dark.
As an aside, I think the lack of rent controls in most American cities, despite their popularity, is a sign that democratic republics work as intended.
i.e., that middle-income Americans would tend to be the winners of the policy, while other Americans get locked out of the housing market because few landlords want to rent out more housing with controls in place
Note that scientists don’t oppose fun. If you would like to believe in some pseudoscience for your enjoyment, that’s fine. Just don’t use a healing crystal in place of the measles vaccine.
There is a real placebo-controlled study of the power of healing crystals from someone named “C.C. French” but it’s surprisingly difficult to find the original version. Here’s one description of it: https://www.livescience.com/40347-crystal-healing.html
https://www.aeaweb.org/research/occupational-matching-cities-wages-us
You might make a terrible mistake when thinking about this issue and assume that companies pay people more in larger cities to cover the cost of housing. That is not how it works. Companies pay workers more in large cities because labor productivity is higher there. If housing were the reason, they would gladly move their operations to cheaper locations. If this makes you think “Well, they wouldn’t do that, there’s just something special about where they are now”, you’re on the right track. You might also consider how silly it would be for a company to pay you more because your rent doubled.
https://www.chicagobooth.edu/review/what-economists-think-about-a-15-minimum-wage ; https://slatestarcodex.com/2014/12/12/beware-the-man-of-one-study/
And not because a remarkable study came out in the meantime that changed their minds.
My paraphrasing of Scott Alexander in this paragraph is so heavy that it’s arguably plagiarism, but it’s only one paragraph and his work is cited, so I decided to keep this part.
One of my writing professors, Kara Reynolds, once recommended that I avoid language like “negative effect on x” because laymen might not understand what it means. I’m sticking with it anyway and praying that she was wrong, because it’s often easier to write.
Obviously, you can improve your forecast with more information like the season, and the best weather forecasters use even more information than that. But I’m keeping this example simple.
Note that the interval is random, not the effect, so it would be wrong to say the effect has a 95% chance of being in the interval.
His use of the semicolon here was inappropriate, I think. You should only use it to separate two parts of a sentence that would make sense independently. Technically, “Hence, not only does social science have no laws” works as an independent clause, but it’s very unnatural to treat it this way, because “not only x” suggests to the listener that they will hear “not only x, y”.
I really want to provide further details here. The problem of the Great Depression was insufficient aggregate demand, meaning demand throughout the whole economy. Part of what drove aggregate demand downward was the loss of wealth in the 1929 stock market crash, making consumers thriftier because they were poorer. Once aggregate demand had fallen, it got stuck, since the Fed had constrained the money supply. Businesses couldn’t invest to get the economy going again. Imagine being a business short on cash, happy to employ people, but unable to get a loan. If lots of businesses are like this, there’s nobody employed by other businesses to buy their products.
See https://en.wikipedia.org/wiki/Myers%E2%80%93Briggs_Type_Indicator or in particular https://compass.onlinelibrary.wiley.com/doi/10.1111/spc3.12434
Interestingly, the very first visual description of supply and demand, like the ones shown in microeconomics classes today, was created long after Smith by Fleeming Jenkin in 1870.
In this case, it was economist Angus Deaton who agreed. Unfortunately, he didn’t provide an explanation.
While we’re on the subject: anyone who says the economics Nobel isn’t a real Nobel prize is coping hard. The official Nobel Prize organization includes the memorial prize on its website.
PDF warning: https://www.aeaweb.org/conference/2019/preliminary/paper/Y4Fdr86H
I have never liked the change from using “female” as the adjective for woman to using “woman” as the adjective for woman. It still feels like bad grammar whenever I type something like “woman economist”, and the whole idea oozes with meaningless sensitivity and a need for comforting language over effective policy. It’s the kind of ignorant advocacy that gave us “post-traumatic stress disorder” rather than “shell shock”, along with a neglected veteran population. Out of spite, I still use “male” as the adjective for a man.
This is my second most reactionary opinion; I would also like to require all pitbulls to be sterilized. HT for the study: John Holbein.
“Greed is good” people are annoying. It’s only good as often as it is because of the government. We’re better off pointing to more genuine reasons why people should be skeptical of government, like cartels that the United States government has enforced in telecom and air travel and continues to enforce in the legal and medical profession.
More specifically, if there is a 95% chance that you avoid picking up a non-existance relationship, the probability of successfully doing that 20 times in a row (if these probabilities are independent, which may not be true) is 0.95^20 = 0.3584859224.
I mentioned earlier that this is why we can’t know how often studies should have p-values in the 0.01 to 0.05 range. Technically, the problem is that we don’t know what share of tested relationships are true.
ChatGPT is surprisingly good at providing derivations for these things if you want them.
Joke titles seem to be exceedingly common among papers written about the field of economics itself, but a quick perusal of NBER working papers will show you that economists are usually serious people.
Interestingly, Christensen and Miguel noted that they know of no empirical research investigating the optimal duration of this type of property right.
I avoided spending too much time talking about the contents of this book because I want the focus to be on economics. But it’s a fascinating read for anyone interested in the sciences.