About a week ago, I spent a long and frustrating day torturing myself and a couple of robots. I’ve been fascinated by G. Elliott Morris’s publicly-accessible presidential election model, which I managed to run on my computer. That was mostly a challenge in understanding how RStudio works. Weeks later, I wanted to convert this model into a model of the midterm elections.
After quickly realizing the complexity of the House elections (not only are there 435 of them, you also have to deal with the redistricting process somehow), I settled on the Senate elections, which are easier to handle. I tried asking ChatGPT and Claude to look at Morris’s model and convert it into a model of the Senate elections, and entered a cycle of copying and pasting their output, running it, copying whatever error occurs, and pasting it into their chat so they can figure it out. Throughout this process I also had to collect new data from Wikipedia and even turn to IPUMS for more recent American Community Survey data on race, age, and educational attainment throughout the country.
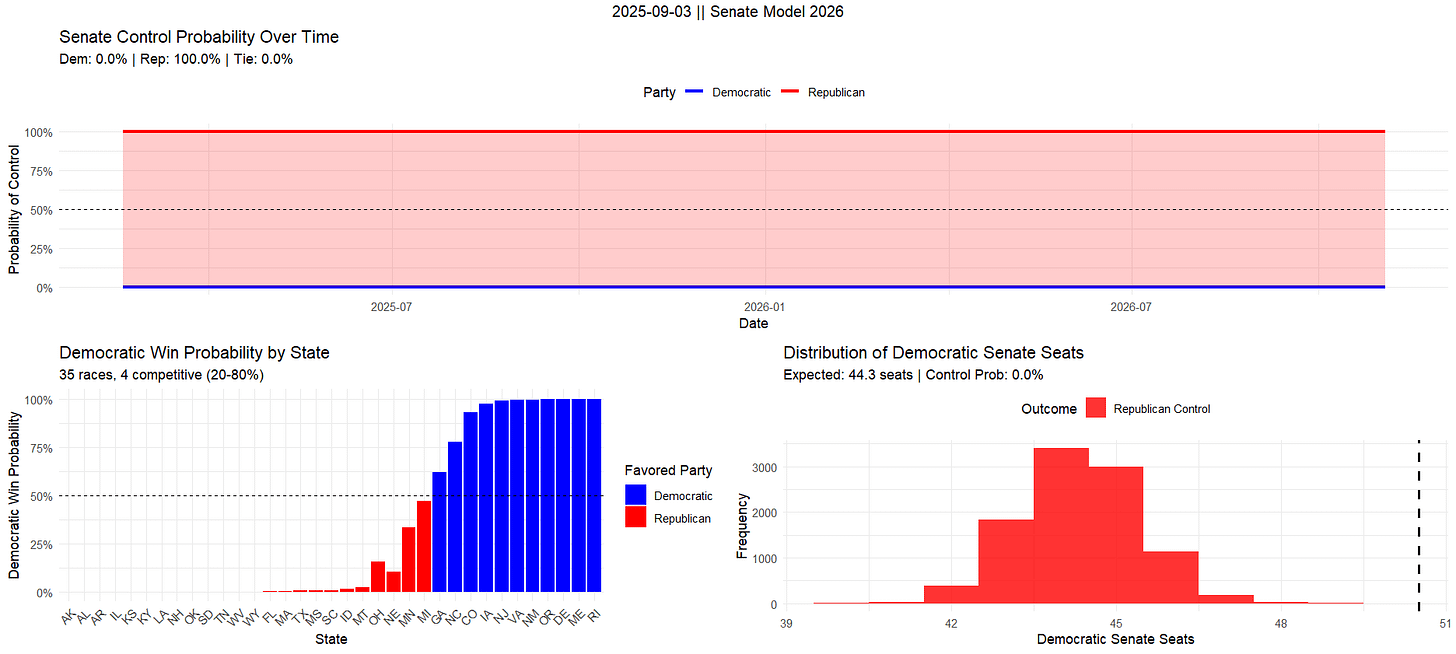
After many hours of doing this, I was stuck with models that could only produce 100% probabilities, with the first “success” providing a 100% probability that Republicans retain control, and the second providing the same probability for Democrats. The models were long, took a long time to run (like the original), and sucked. I spent many more hours trying to figure out what was wrong with them, or just build a better model from scratch. This did not work and quickly became too much for me to handle.
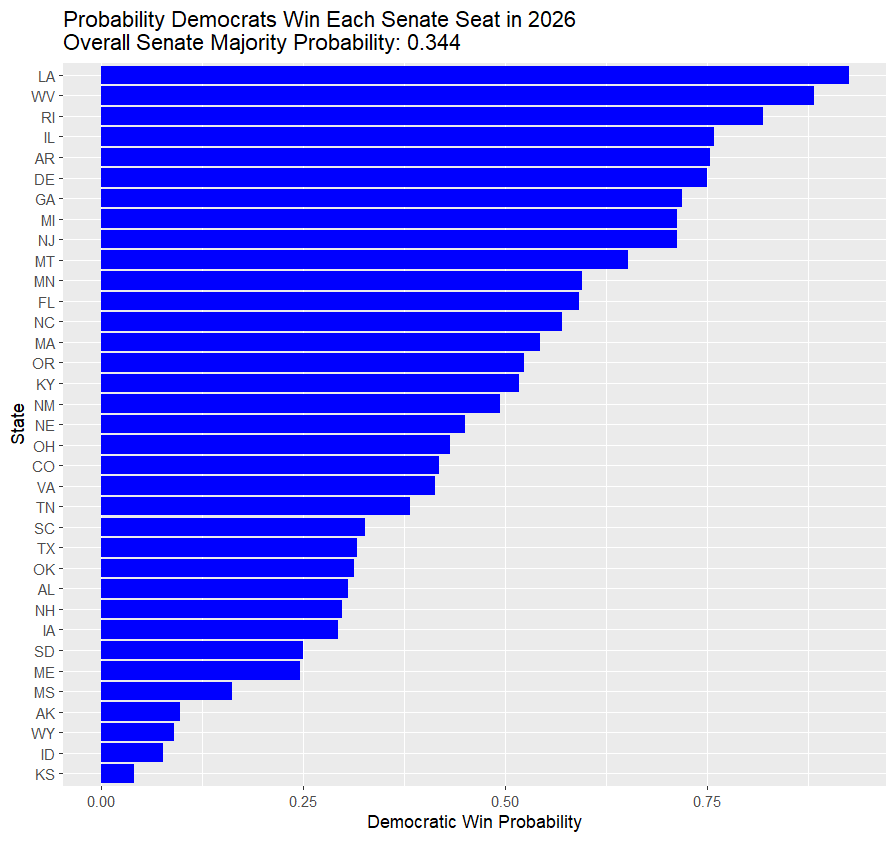
In the end I decided I would ask ChatGPT, Claude, Gemini, and Mistral for a model, given only the data I had collected and the states up for election (since they didn’t seem to know). At least one of them had to produce something reasonable. Here’s what ChatGPT’s R model spat out:
Apparently Democrats can be confident that they’ll pick up two Senate seats in Louisiana and West Virginia, but things are looking shakey in Oregon. But hey, at least the overall win probability is in line with conventional estimates available on Polymarket and Kalshi.
Next up is Claude. Claude was smart enough to produce an R model that generates this image, which at least looks reasonable:
I checked eleven of the states people are betting on via Kalshi, and the order was almost the same as what Claude produced above. There were a couple of glaring issues, though: Claude considers NH and FL tossups, but bettors consider them heavily slanted toward Democrats and Republicans. I’m not sure how the horizontal axis is supposed to be interpreted because it suggests that every single race is going to be a nail-biter if you interpret it as the margin of victory. But for the most part, the red states are red and the blue states are blue.
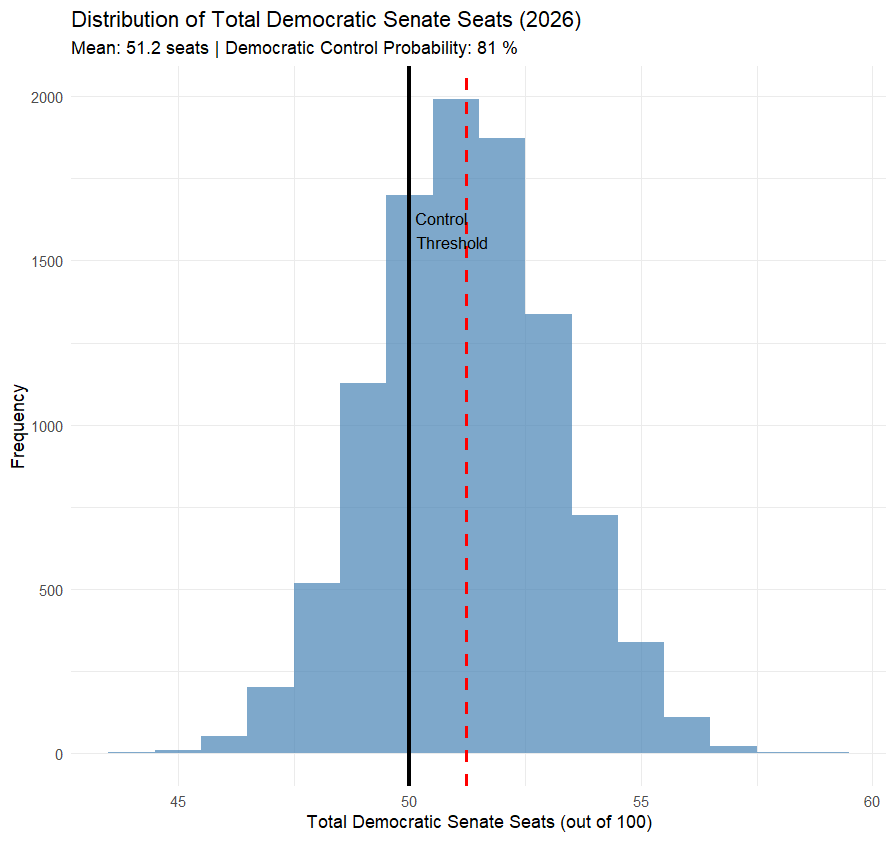
Unfortunately, Claude’s model produced this image as well (after I asked it to rewrite its code to include an overall win probability in a bell curve illustration):
This isn’t batshit insane, but 81% odds in favor of the Democrats is still way out of line with what almost every human giving serious attention to this question has come up with.
But maybe you just need the right prompt. I tried again, this time attaching Linzer’s paper on dynamic Bayesian forecasting and asking for a model based on it. It produced 241 lines of R code that gave me some reasonable-looking forecasts for 2026. Troublingly, these forecasts are based on historical priors created from previous elections, which the model does not update based on the polls it’s given. When I went back to this model to run it again, it got to the part that prints “Running Bayesian model with 3 polls” and got stuck.
Into the Large Language Polling Averages
To start working on polling averages, I needed data, and to get that data, I either needed to find it online as a single csv file or create the csv myself. After emailing the Roper center for such a csv and getting impatient, I went with option 2.
Claude turned out to be much better at things I have a good conceptual understanding of and can explain in detail. (Who knew?) I needed to get polling data from RealClearPolling, an online source of polling data with thousands of polls available for US Senate elections going back to 2006. After discovering that Claude didn’t really know how to write a Python script that pulls data from one of these pages, I dove into the source code of the webpage to try to figure it out, beginning with the 2006 US Senate election in Connecticut. If you right click the page and hit “View Page Source”, you get an incomprehensible spell to form a Lament Configuration from metaphysical particles and summon the Cenobites. But because this spell appears in a consistent format, all I needed was to get Claude to create a script that finds every part of the source code that looks like this [bolding is mine]:
\"pollster\":\"Rasmussen\",\"pollster_group_name\":\"Rasmussen Reports\",\"pollster_group_id\":\"456\",\"updated\":\"\",\"link\":\"http://www.rasmussenreports.com/MembersOnly/2006%20State%20Polls/April%202006/CT_042706%20Toplines.htm\",\"link_past_results\":\"\",\"date\":\"4/27 - 4/27\",\"data_start_date\":\"2005/04/27\",\"data_end_date\":\"2005/04/27\",\"confidenceInterval\":null,\"sampleSize\":\"500 LV\",\"marginError\":null,\"partisan\":\"\",\"pollster_type\":\"1\",\"show_tracking_label\":\"0\",\"data_show\":\"1\",\"candidate\":[{\"name\":\"Lamont\",\"affiliation\":\"Democrat\",\"value\":\"20\",\"status\":\"1\"},{\"name\":\"Lieberman\",\"affiliation\":\"Independent\",\"value\":\"47\",\"status\":\"1\"},{\"name\":\"Schlesinger\",\"affiliation\":\"Republican\",\"value\":\"\",\"status\":\"2\"}]
and then generate a csv where each row looks like this:
Rasmussen, 2005/04/27, 2005/04/27, 500, LV, 20, 47
which provides the pollster, start date, end date, number of respondents, type of respondents (“LV” means “likely voters”), and the shares of respondents supporting each candidate, in order of appearance.
As it turns out, the order of appearance is inconsistent, so you can’t just assume that the first number found is going to be for a Republican or Democrat. But Claude was able to look at this example and build some code that pulls the needed information and, after some further prompting, add those numbers to the correct column depending on the accompanying party ID. Hours of more prompting and testing eventually lead to a script that can take multiple links as inputs and produce a csv of every poll contained in every link. Maybe there was a way to further automate the process, but I spent the rest of the day using this script to enter every link for almost every page for every Senate race going back to 2006. There are a lot of these links, so this took a while, but not nearly as long as this would take if I entered each poll manually. (I would guess more than ten times as long, given the number of polls on each page.)
Sometimes Claude had a goofily poor conceptual understanding of what to do, so I had to come up with a method and tell it to do that. Notice how that source code snippet I gave you is separated by lots of slashes? I had to explicitly instruct it to count these to identify the right data. But once I gave it these human pro tips, it knew how to write the code to use these simpler ideas.
What can Claude do with data like this? Whatever I can think of, apparently. I was able to produce simple weekly polling averages, biweekly averages, overlapping biweekly averages (averages of every poll conducted in the past two weeks, created for every week), and averages that weight based on recency. Claude even generated the code to combine datasets on election outcomes with the polling data I had and the new polling averages that were generated. After that, I could perform probit regressions of election outcomes on these averages at different points in time.
The more dangerous part was when I needed data on incumbency, so Claude suggested I ask it to generate the data. It didn’t search the internet to do this, so I have essentially no idea where these numbers came from. This isn’t something I can use without a huge disclaimer. But FWIW, every time I checked, the output was correct, and the incumbency advantage was clearly visible in regression output, as expected. On that note, I checked other kinds of output Claude’s code produced over and over again, like the polls it scraped from the internet. The only problem I ever saw occurred when survey type indicators (“RV” or “LV” for registered and likely voters) appeared in place of the number of respondents in the source code, since sometimes that number wasn’t given. When I chose a random biweekly polling average to calculate by hand, I got the exact same number I could find in the R dataframe.
I’m pretty pretty sure that if I just keep prompting and putting the pieces together, I’ll have a complete model to forecast the 2026 US Senate elections with. But if that happens, it’ll be because I learned how to build such a model and asked for the code, not because Claude or ChatGPT figured out the whole thing and did it for me. The lesson here is that this is a very good time to be someone with a great conceptual understanding of these things1 and little coding knowledge, but if you don’t have any understanding of how something would be done, LLMs won’t get you all the way.
I only toot my own horn when I have a lot of evidence to back my statement up.


